Chapter IV AIR BLAST LOADING
INTERACTION OF BLAST WAVE WITH STRUCTURES
INTRODUCTION
4.01 The phenomena associated with the blast wave in air from a nuclear explosion have been treated in the preceding chapter. The behavior of _an object or structure exposed to such a wave may be considered under two main headings. The first, called the “loading,” i.e., the forces which result from the action of the blast pressure, is the subject of this chapter. The second, the “response” or distortion of the structure due to the particular loading, is treated in the next chapter.
4.02 For an air burst, the direction of propagation of the incident blast wave will be toward the ground at ground zero. In the regular reflection region, where the direction of propagation of the blast wave is not parallel to the horizontal axis of the structure, the forces exerted upon structures will also have a considerable downward component (prior to passage of the reflected wave) due to the reflected pressure buildup on the horizontal surfaces. Consequently, in addition to the horizontal loading, as in the Mach region (§ 3.24 et seq.), there will also be initially an appreciable downward force. This tends to cause crushing toward the ground, e.g., dished-in roofs, in addition to distortion due to translational motion.
4.03 The discussion of air blast loading for aboveground structures in the Mach region in the sections that follow emphasizes the situation where the reflecting surface is nearly ideal (§ 3.47) and the blast wave behaves normally, in accordance with theoretical considerations. A brief description of blast wave loading in the precursor region (§ 3.79 et seq.) is also given. For convenience, the treatment will be somewhat arbitrarily divided into two parts: one deals with “diffraction loading,” which is determined mainly by the peak overpressure in the blast wave, and the other with “drag loading,” in which the dynamic pressure is the significant property. It is important to remember, however, that all structures are subjected simultaneously to both types of loading, since the overpressure and dynamic pressure cannot be separated, although for certain structures one may be more important than the other.
4.04 Details of the interaction of a blast wave with any structure are quite complicated, particularly if the geometry of the structure is complex. However, it is frequently possible to consider equivalent simplified geometries, and blast loadings of several such geometries are discussed later in this chapter.
DIFFRACTION LOADING
4.05 When the front of an air blast wave strikes the face of a structure, reflection occurs. As a result the overpressure builds up rapidly to at least twice (and generally several times) that in the incident wave front. The actual pressure attained is determined by various factors, such as the peak overpressure of the incident blast wave and the angle between the direction of motion of the wave and the face of the structure (§ 3.78). The pressure increase is due to the conversion of the kinetic energy of the air behind the shock front into internal energy as the rapidly moving air behind the shock front is decelerated at the face of the structure. The reflected shock front propagates back into the air in all directions. The high pressure region expands outward towards the surrounding regions of lower pressure.
4.06 As the wave front moves forward, the reflected overpressure on the face of the structure drops rapidly to that produced by the blast wave without reflection,1 plus an added drag force due to the wind (dynamic) pressure. At the same time, the air pressure wave bends or “diffracts” around the structure, so that the structure is eventually engulfed by the blast, and approximately the same pressure is exerted on the sides and the roof. The front face, however, is still subjected to wind pressure, although the back face is shielded from it.
4.07 The developments described above are illustrated in a simplified form in Figs. 4.07a, b, c, d, e;2 this shows, in plan, successive stages of a structure without openings which is being struck by an air blast wave moving in a horizontal direction. In Fig. 4.07a the wave front is seen approaching the structure with the direction of motion perpendicular to the face of the structure exposed to the blast. In Fig. 4.07b the wave has just reached the front face, producing a high reflected overpressure. In Fig. 4.07c the blast wave has proceeded about halfway along the structure and in Fig. 4.07d the wave front has just passed the rear of the structure. The pressure on the front face has dropped to some extent while the pressure is building up on the back face as the blast wave diffracts around the structure. Finally, when the wave front has passed completely, as in Fig. 4.07e, approximately equal air pressures are exerted on the sides and top of the structure. A pressure difference between front and back faces, due to the wind forces, will persist, however, during the whole positive phase of the blast wave. If the structure is oriented at an angle to the blast wave, the pressure would immediately be exerted on two faces, instead of one, but the general characteristics of the blast loading would be similar to that just described (Figs. 4.07f, g, h, and i).
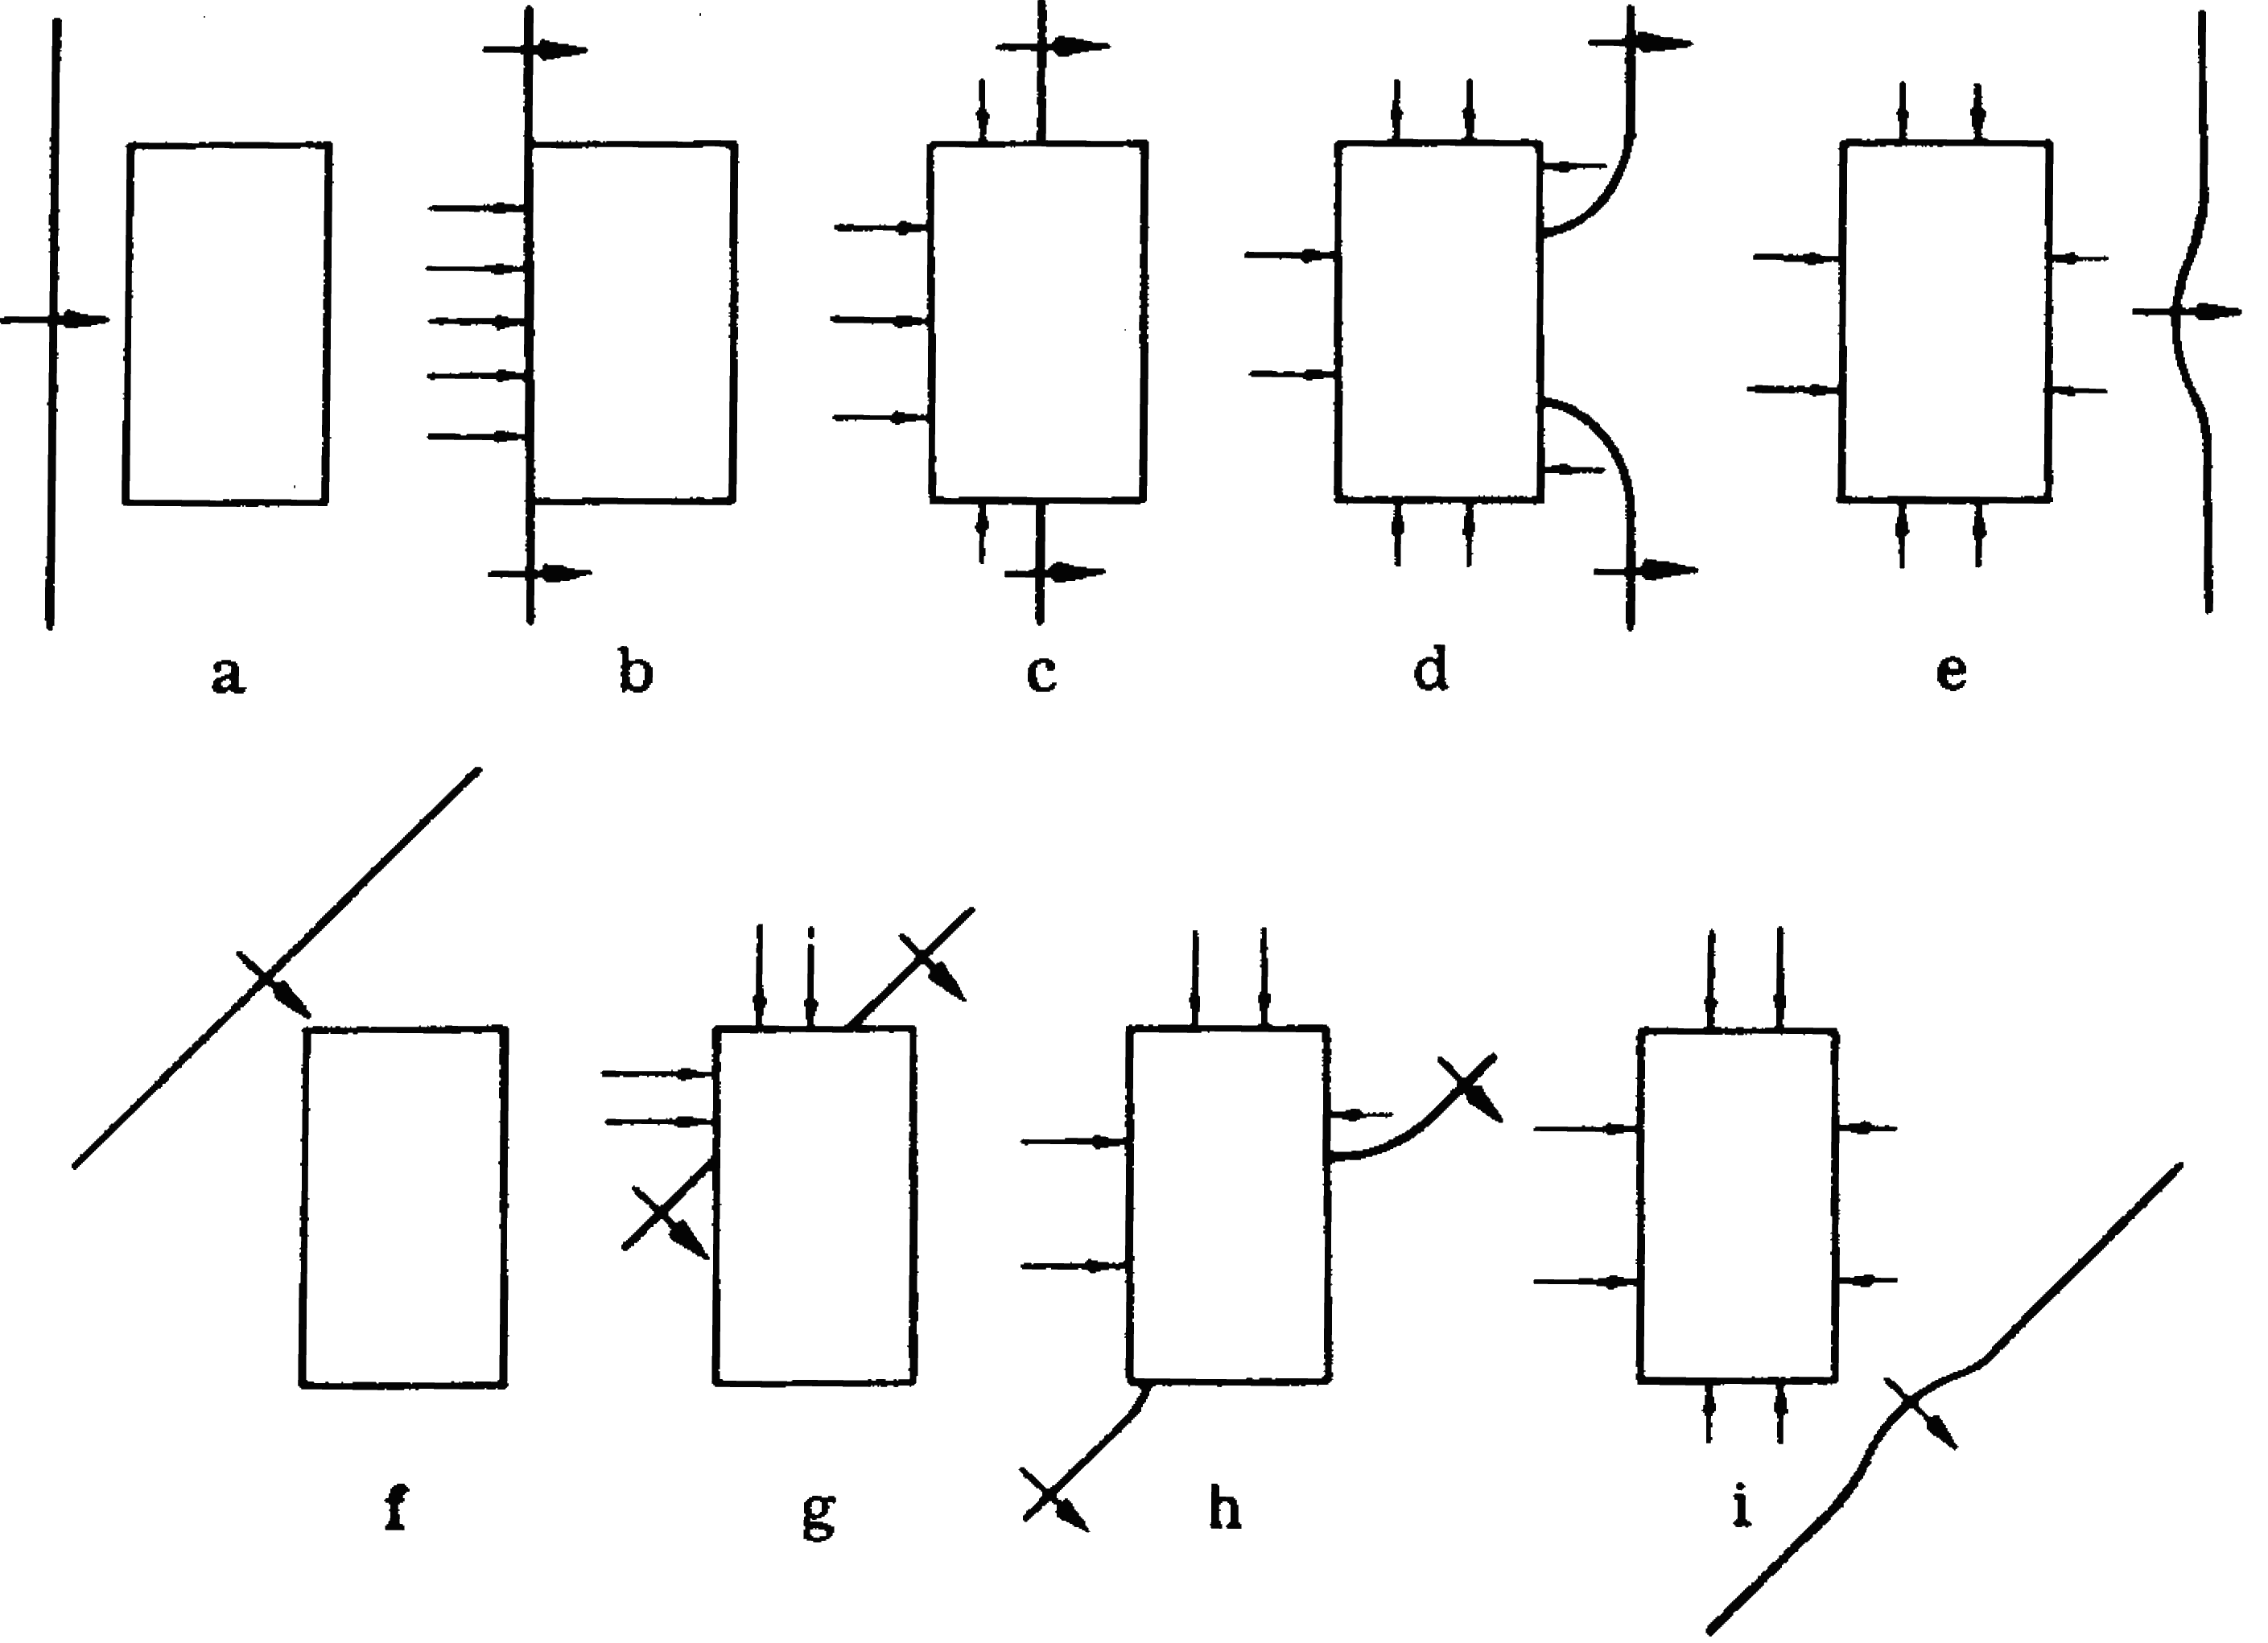
4.08 The pressure differential between the front and back faces will have its maximum value when the blast wave has not yet completely surrounded the structure, as in Figs. 4.07b, c, and d or g and h. Such a pressure differential will produce a lateral (or translational) force tending to cause the structure to deflect and thus move bodily, usually in the same direction as the blast wave. This force is known as the “diffraction loading” because it operates while the blast wave is being diffracted around the structure. The extent and nature of the response will depend upon the size, shape, and weight of the structure and how firmly it is attached to the ground. Other characteristics of the structure are also important in determining the response, as will be seen later.
4.09 When the blast wave has engulfed the structure (Fig. 4.07e or 4.07i), the pressure differential is small, and the loading is due almost entirely to the drag pressure3 exerted on the front face. The actual pressures on all faces of the structure are in excess of the ambient atmospheric pressure and will remain so, although decreasing steadily, until the positive phase of the blast wave has ended. Hence, the diffraction loading on a structure without openings is eventually replaced by an inwardly directed pressure, i.e., a compression or squeezing action, combined with the dynamic pressure of the blast wave. In a structure with no openings, the loading will cease only when the overpressure drops to zero.
4.10 The damage caused during the diffraction stage will be determined by the magnitude of the loading and by its duration. The loading is related to the peak overpressure in the blast wave and this is consequently an important factor. If the structure under consideration has no openings, as has been assumed so far, the duration of the diffraction load- ing will be very roughly the time required for the wave front to move from the front to the back of the building, although wind loading will continue for a longer period. The size of the structure will thus affect the diffraction loading. For a structure 75 feet long, the diffraction loading will operate for a period of about one-tenth of a second, but the squeezing and the wind loading will persist for a longer time (§ 4.13). For thin structures, e.g., telegraph or utility poles and smokestacks, the diffraction period is so short that the corresponding loading is negligible.
4.11 If the building exposed to the blast wave has openings, or if it has windows, panels, light siding, or doors which fail in a very short space of time, there will be a rapid equalization of pressure between the inside and outside of the structure. This will tend to reduce the pressure differential while diffraction is occurring. The diffraction loading on the structure as a whole will thus be decreased, although the loading on interior walls and partitions will be greater than for an essentially closed structure, i.e., one with few openings. Furthermore, if the building has many openings, the squeezing (crushing) action, due to the pressure being higher outside than inside after the diffraction stage, will not occur.
DRAG (DYNAMIC PRESSURE) LOADING
4.12 During the whole of the overpressure positive phase (and for a short time thereafter) a structure will be subjected to the dynamic pressure (or drag) loading caused by the transient winds behind the blast wave front. Under nonideal (precursor) conditions, a dynamic pressure loading of varying strength may exist prior to the maximum overpressure (diffraction) loading. Like the diffraction loading, the drag loading, especially in the Mach region, is equivalent to a lateral (or translational) force acting upon the structure or object exposed to the blast.
4.13 Except at high blast overpressures, the dynamic pressures at the face of a structure are much less than the peak overpressures due to the blast wave and its reflection (Table 3.07). However, the drag loading on a structure persists for a longer period of time, compared to the diffraction loading. For example, the duration of the positive phase of the dynamic pressure on the ground at a slant range of 1 mile from a 1-megaton nuclear explosion in the air is almost 3 seconds. On the other hand, the diffraction loading is effective only for a small fraction of a second, even for a large structure, as seen above.
4.14 It is the effect of the duration of the drag loading on structures which constitutes an important difference between nuclear and high-explosive detonations. For the same peak overpressure in the blast wave, a nuclear weapon will prove to be more destructive than a conventional one, especially for buildings which respond to drag loading. This is because the blast wave is of much shorter duration for a high-explosive weapon, e.g., a few hundredths of a second. As a consequence of the longer duration of the positive phase of the blast wave from weapons of high energy yield, such devices cause more damage to drag-sensitive structures (§ 4.18) than might be expected from the peak overpressures alone.
STRUCTURAL CHARACTERISTICS AND AIR BLAST LOADING
4.15 In analyzing the response to blast loading, as will be done more fully in Chapter V, it is convenient to consider structures in two categories, i.e., diffraction-type structures and drag-type structures. As these names imply, in a nuclear explosion the former would be affected mainly by diffraction loading and the latter by drag loading. It should be emphasized, however, that the distinction is made in order to simplify the treatment of real situations which are, in fact, very complex. Although it is true that some structures will respond mainly to diffraction forces and others mainly to drag forces, actually all buildings will respond to both types of loading. The relative importance of each type of loading in causing damage will depend upon the type of structure as well as on the characteristics of the blast wave. These facts should be borne in mind in connection with the ensuing discussion.
4.16 Large buildings having a moderately small window and door area and fairly strong exterior walls respond mainly to diffraction loading. This is because it takes an appreciable time for the blast wave to engulf the building, and the pressure differential between front and rear exists during the whole of this period. Examples of structures which respond mainly to diffraction loading are multistory, reinforced-concrete buildings with small window area, large wall-bearing structures such as apartment houses, and wood-frame buildings such as dwelling houses.
4.17 Because, even with large structures, the diffraction loading will generally be operative for a fraction of a second only, the duration of the blast wave positive phase, which is usually much longer, will not be significant. In other words, the length of the blast wave positive phase will not materially affect the net translational loading (or the resulting damage) during the diffraction stage. A diffraction-type structure is, therefore, primarily sensitive to the peak overpressure in the blast wave to which it is exposed. Actually it is the associated reflected overpressure on the structure that largely determines the diffraction loading, and this may be several times the incident blast overpressure (§ 3.78).
4.18 When the pressures on different areas of a structure (or structural element) are quickly equalized, either because of its small size, the characteristics of the structure (or element), or the rapid formation of numerous openings by action of the blast, the diffraction forces operate for a very short time. The response of the structure is then mainly due to the dynamic pressure (or drag force) of the blast wind. Typical drag-type structures are smokestacks, telephone poles, radio and television transmitter towers, electric transmission towers, and truss bridges. In all these cases the diffraction of the blast wave around the structure or its component elements requires such a very short time that the diffraction processes are negligible, but the drag loading may be considerable.
4.19 The drag loading on a structure is determined not only by the dynamic pressure, but also by the shape of the structure (or structural element). The shape factor (or drag coefficient) is less for rounded or streamlined objects than for irregular or sharp-edged structures or elements. For example, for a unit of projected area, the loading on a telephone pole or a smokestack will be less than on an I-beam. Furthermore, the drag coefficient can be either positive or negative, according to circumstances (§ 4.29).
4.20 Steel (or reinforced-concrete) frame buildings with light walls made of asbestos cement, aluminum, or corrugated steel, quickly become drag-sensitive because of the failure of the walls at low overpressures. This failure, accompanied by pressure equalization, occurs very soon after the blast wave strikes the structure, so that the frame is subject to a relatively small diffraction loading. The distortion, or other damage, subsequently experienced by the frame, as well as by narrow elements of the structure, e.g., columns, beams, and trusses, is then caused by the drag forces.
4.21 For structures which are fundamentally of the drag type, or which rapidly become so because of loss of siding, the response of the structure or of its components is determined by both the drag loading and its duration. Thus, the damage is dependent on the duration of the positive phase of the blast wave as well as on the peak dynamic pressure. Consequently, for a given peak dynamic pressure, an explosion of high energy yield will cause more damage to a drag-type structure than will one of lower yield because of the longer duration of the positive phase in the former case (see § 5.48 et seq.).
INTERACTION OF OBJECTS WITH AIR BLAST4
DEVELOPMENT OF BLAST LOADING
4.22 The usual procedure for predicting blast damage is by an analysis, supported by such laboratory and full-scale observations as may be available. The analysis is done in two stages: first the air blast loading on the particular structure is determined; and second, an evaluation is made of the response of the structure to this loading. The first stage of the analysis for a number of idealized targets of simple shape is discussed in the following sections. The second stage is treated in Chapter V.
4.23 The blast loading on an object is a function of both the incident blast wave characteristics, i.e., the peak overpressure, dynamic pressure, decay, and duration, as described in Chapter III, and the size, shape, orientation, and response of the object. The interaction of the incident blast wave with an object is a complicated process, for which a theory, supported primarily by experimental data from shock tubes and wind tunnels, has been developed. To reduce the complex problem of blast loading to reasonable terms, it will be assumed, for the present purpose, that (1) the overpressures of interest are less than 50 pounds per square inch (dynamic pressures less than about 40 pounds per square inch), and (2) the object being loaded is in the region of Mach reflection.
4.24 To obtain a general idea of the blast loading process, a simple object, namely, a cube with one side facing toward the explosion, will be selected as an example. It will be postulated, further, that the cube is rigidly attached to the ground surface and remains motionless when subjected to the loading. The blast wave (or shock) front is taken to be of such size compared to the cube that it can be considered to be a plane wave striking the cube. The pressures referred to below are the average pressures on a particular face. Since the object is in the region of Mach reflection, the blast front is perpendicular to the surface of the ground. The front of the cube, i.e., the side facing toward the explosion, is normal to the direction of propagation of the blast wave (Fig. 4.24).
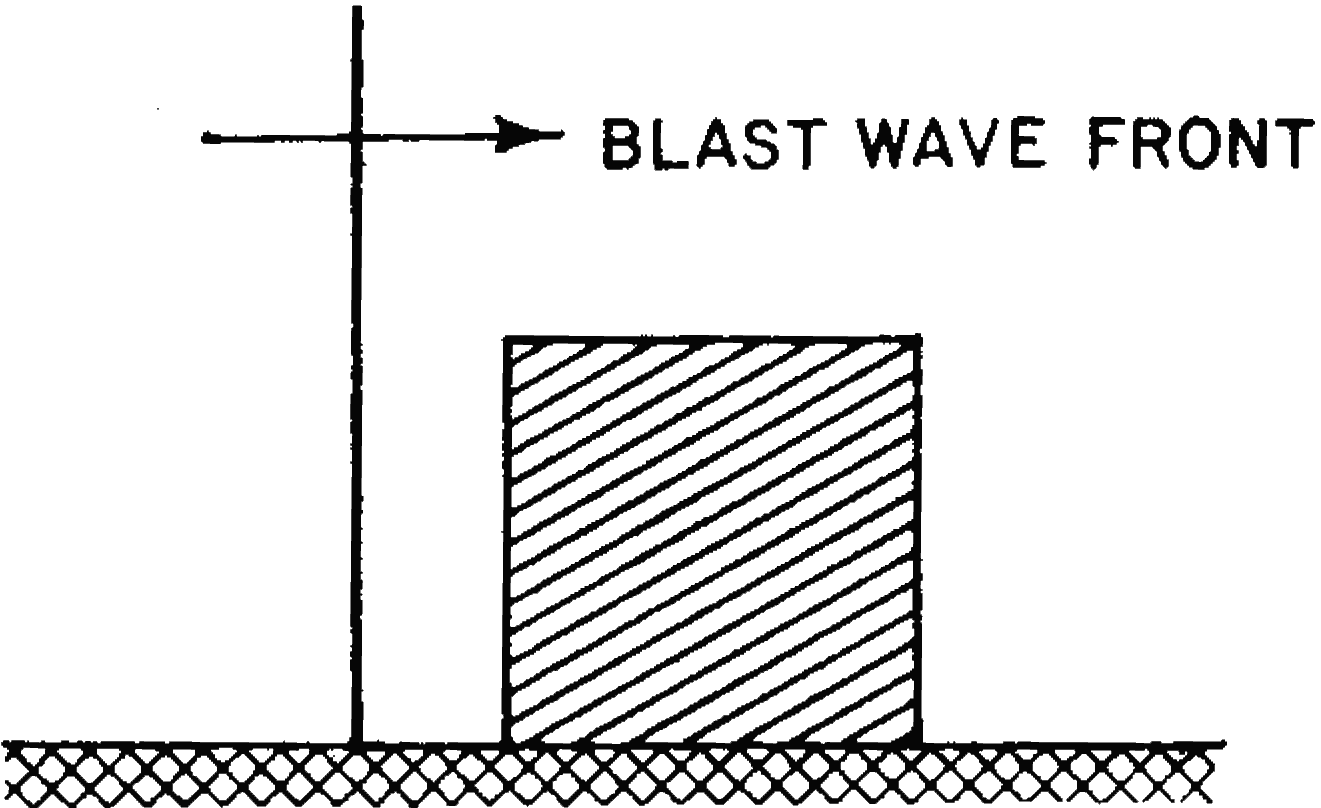
4.25 When the blast wave strikes the front of the cube, reflection occurs producing reflected pressures which may be from two to eight times as great as the incident overpressure (§ 3.56). The blast wave then bends (or diffracts) around the cube exerting pressures on the sides and top of the object, and finally on its back face. The object is thus engulfed in the high pressure of the blast wave and this decays with time, eventually returning to ambient conditions. Because the reflected pressure on the front face is greater than the pressure in the blast wave above and to the sides, the reflected pressure cannot be maintained and it soon decays to a “stagnation pressure,” which is the sum of the incident overpressure and the dynamic (drag) pressure. The decay time is roughly that required for a rarefaction wave to sweep from the edges of the front face to the center of this face and back to the edges.
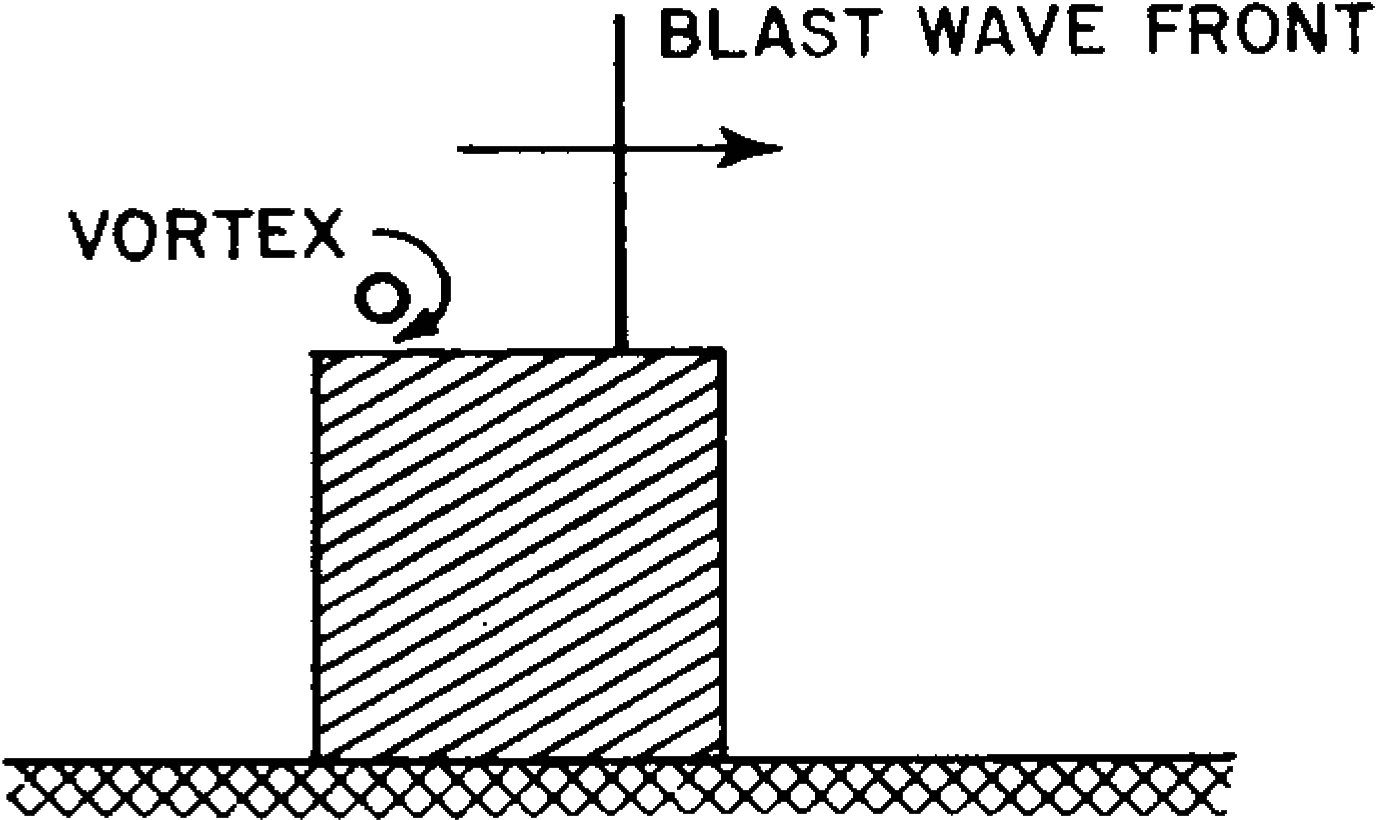
4.26 The pressures on the sides and top of the cube build up to the incident overpressure when the blast front arrives at the points in question. This is followed by a short period of low pressure caused by a vortex formed at the front edge during the diffraction process and which travels along or near the surface behind the wave front (Fig. 4.26). After the vortex has passed, the pressure returns essentially to that in the incident blast wave which decays with time. The air flow causes some reduction in the loading to the sides and top, because, as will be seen in § 4.43, the drag pressure here has a negative value.
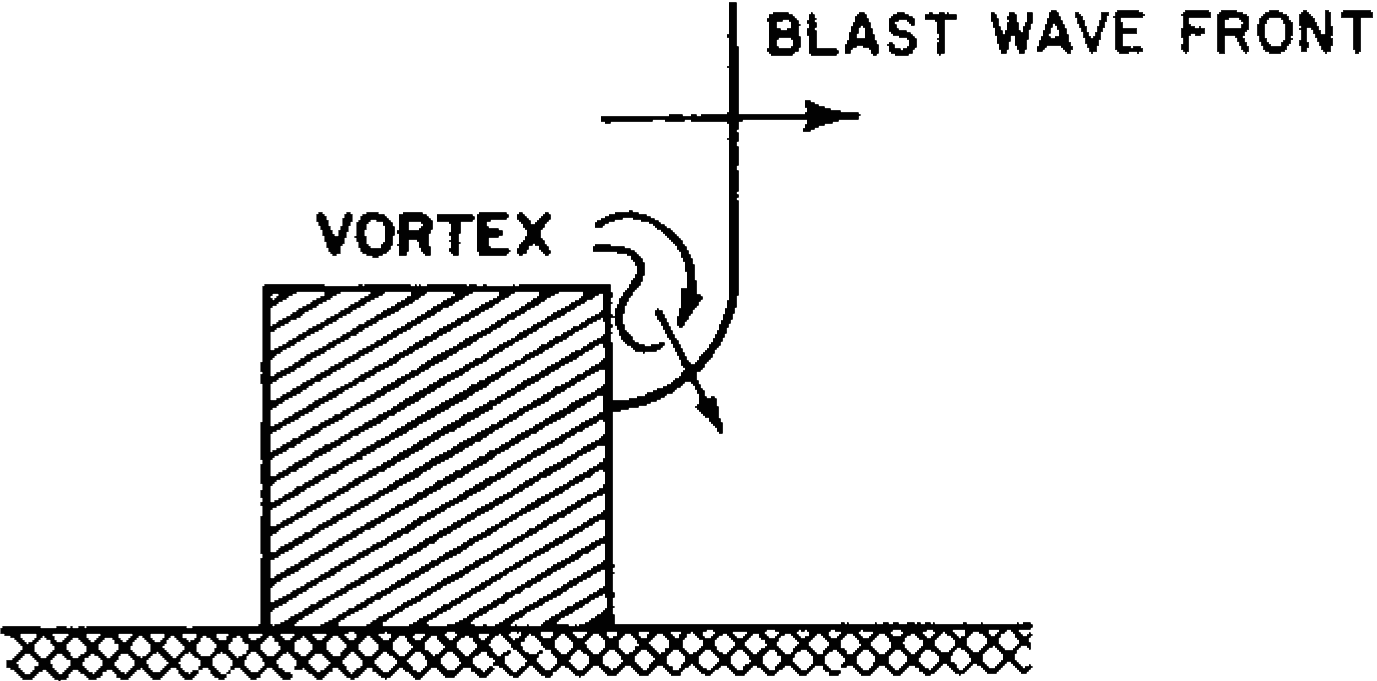
4.27 When the blast wave reaches the rear of the cube, it diffracts around the edges, and travels down the back surface (Fig. 4.27). The pressure takes a certain time (”rise time”) to reach a more-or-less steady state value equal to the algebraic sum of the overpressure and the drag pressure, the latter having a negative value in this case also (§ 4.44). The finite rise time results from a weakening of the blast wave front as it diffracts around the back edges, accompanied by a temporary vortex action, and the time of transit of the blast wave from the edges to the center of the back face.
4.28 When the overpressure at the rear of the cube attains the value of the overpressure in the blast wave, the diffraction process may be considered to have terminated. Subsequently, essentially steady state conditions may be assumed to exist until the pressures have returned to the ambient value prevailing prior to the arrival of the blast wave.
4.29 The total loading on any given face of the cube is equal to the algebraic sum of the respective overpressure, , and the drag pressure. The latter is related to the dynamic pressure, , by the expression
where is the drag coefficient. The value of depends on the orientation of the particular face to the blast wave front and may be positive or negative. The drag pressures (or loading) may thus be correspondingly positive or negative. The quantities and represent the overpressure and dynamic pressure, respectively, at any time, , after the arrival of the wave front (§ 3.57 et seq.).4.30 The foregoing discussion has referred to the loading on the various surfaces in a general manner. For a particular point on a surface, the loading depends also on the distance from the point to the edges and a more detailed treatment is necessary. It should be noted that only the gross characteristics of the development of the loading have been described here. There are, in actual fact, several cycles of reflected and rarefaction waves traveling across the surfaces before damping out, but these fluctuations are considered to be of minor significance as far as damage to the structure is concerned.
EFFECT OF SIZE ON LOADING DEVELOPMENT
4.31 The loading on each surface may not be as important as the net horizontal loading on the entire object. Hence, it is necessary to study the net loading, i.e., the loading on the front face minus that on the back face of the cube. The net horizontal loading during the diffraction process is high because the pressure on the front face is initially the reflected pressure and no loading has reached the rear face.
4.32 When the diffraction process is completed, the overpressure loadings on the front and back faces are essentially equal. The net horizontal loading is then relatively small. At this time the net loading consists primarily of the difference between front and back loadings resulting from the dynamic pressure loading. Because the time required for the completion of the diffraction process depends on the size of the object, rather than on the positive phase duration of the incident blast wave, the diffraction loading impulse per unit area (§ 3.59) is greater for long objects than for short ones.
4.33 The magnitude of the dynamic pressure (or drag) loading, on the other hand, is affected by the shape of the object and the duration of the dynamic pressure. It is the latter, and not the size of the object, which determines the application time (and impulse per unit area) of the drag loading.
4.34 It may be concluded, therefore, that, for large objects struck by blast waves of short duration, the net horizontal loading during the diffraction process is more important than the dynamic pressure loading. As the object becomes smaller, or as the dynamic pressure duration becomes longer, e.g., with weapons of larger yield, the drag loading becomes increasingly important. For classification purposes, objects are often described as “diffraction targets” or “drag targets,” as mentioned earlier, to indicate the loading mainly responsible for damage. Actually, all objects are damaged by the total loading, which is a combination of overpressure and dynamic pressure loadings, rather than by any one component of the blast loading.
EFFECT OF SHAPE ON LOADING DEVELOPMENT
4.35 The description given above for the interaction of a blast wave with a cube may be generalized to apply to the loading on a structure of any other shape. The reflection coefficient, i.e., the ratio of the (instantaneous) reflected overpressure to the incident overpressure at the blast front, depends on the angle at which the blast wave strikes the structure. For a curved structure, e.g., a sphere or a cylinder (or part of a sphere or cylinder), the reflection varies from point to point on the front surface. The time of decay from reflected to stagnation pressure then depends on the size of the structure and the location of the point in question on the front surface.
4.36 The drag coefficient, i.e., the ratio of the drag pressure to the dynamic pressure (§ 4.29), varies with the shape of the structure. In many cases an overall (or average) drag coefficient is given, so that the net force on the surface can be determined. In other instances, local coefficients are necessary to evaluate the , pressures at various points on the surfaces. The time of buildup (or rise time) of the average pressure on the back surface depends on the size and also, to some extent, on the shape of the structure.
4.37 Some structures have frangible portions that are easily blown out by the initial impact of the blast wave, thus altering the shape of the object and the subsequent loading. When windows are blown out of an ordinary building, the blast wave enters and tends to equalize the interior and exterior pressures. In fact, a structure may be designed to have certain parts frangible to lessen damage to all other portions of the structure. Thus, the response of certain elements in such cases influences the blast loading on the structure as a whole. In general, the movement of a structural element is not considered to influence the blast loading on that element itself. However, an exception to this rule arises in the case of an aircraft in flight when struck by a blast wave.
BLAST LOADING-TIME CURVES
4.38 The procedures whereby curves showing the air blast loading as a function of time may be derived are given below. The methods presented are for the following five relatively simple shapes: (1) closed box-like structure; (2) partially open box-like structure; (3) open frame structure; (4) cylindrical structure; and (5) semicircular arched structure. These methods can be altered somewhat for objects having similar characteristics. For very irregularly shaped structures, however, the procedures described may provide no more than a rough estimate of the blast loading to be expected.
4.39 As a general rule, the loading analysis of a diffraction-type structure is extended only until the positive phase overpressure falls to zero at the surface under consideration. Although the dynamic pressure persists after this time, the value is so small that the drag force can be neglected. However, for dragtype structures, the analysis is continued until the dynamic pressure is zero. During the negative overpressure phase, both overpressure and dynamic pressure are too small to have any significant effect on structures (§ 3.11 et seq.).
4.40 The blast wave characteristics which need to be known for the loading analysis and their symbols are summarized in Table 4.40. The locations in Chapter III where the data may be obtained, at a specified distance from ground zero for an explosion of given energy yield and height of burst, are also indicated.
| Property | Symbol | Source |
|---|---|---|
| Peak overpressure | Figs. 3.73a, b, and c | |
| Time variation of overpressure | Fig. 3.57 | |
| Peak dynamic pressure | Fig. 3.75 | |
| Time variation of dynamic pressure | Fig. 3.58 | |
| Reflected overpressure | Fig. 3.78b | |
| Duration of positive phase of overpressure | Fig. 3.76 | |
| Duration of positive phase of dynamic pressure | Fig. 3.76 | |
| Blast front (shock) velocity | Fig. 3.55 |
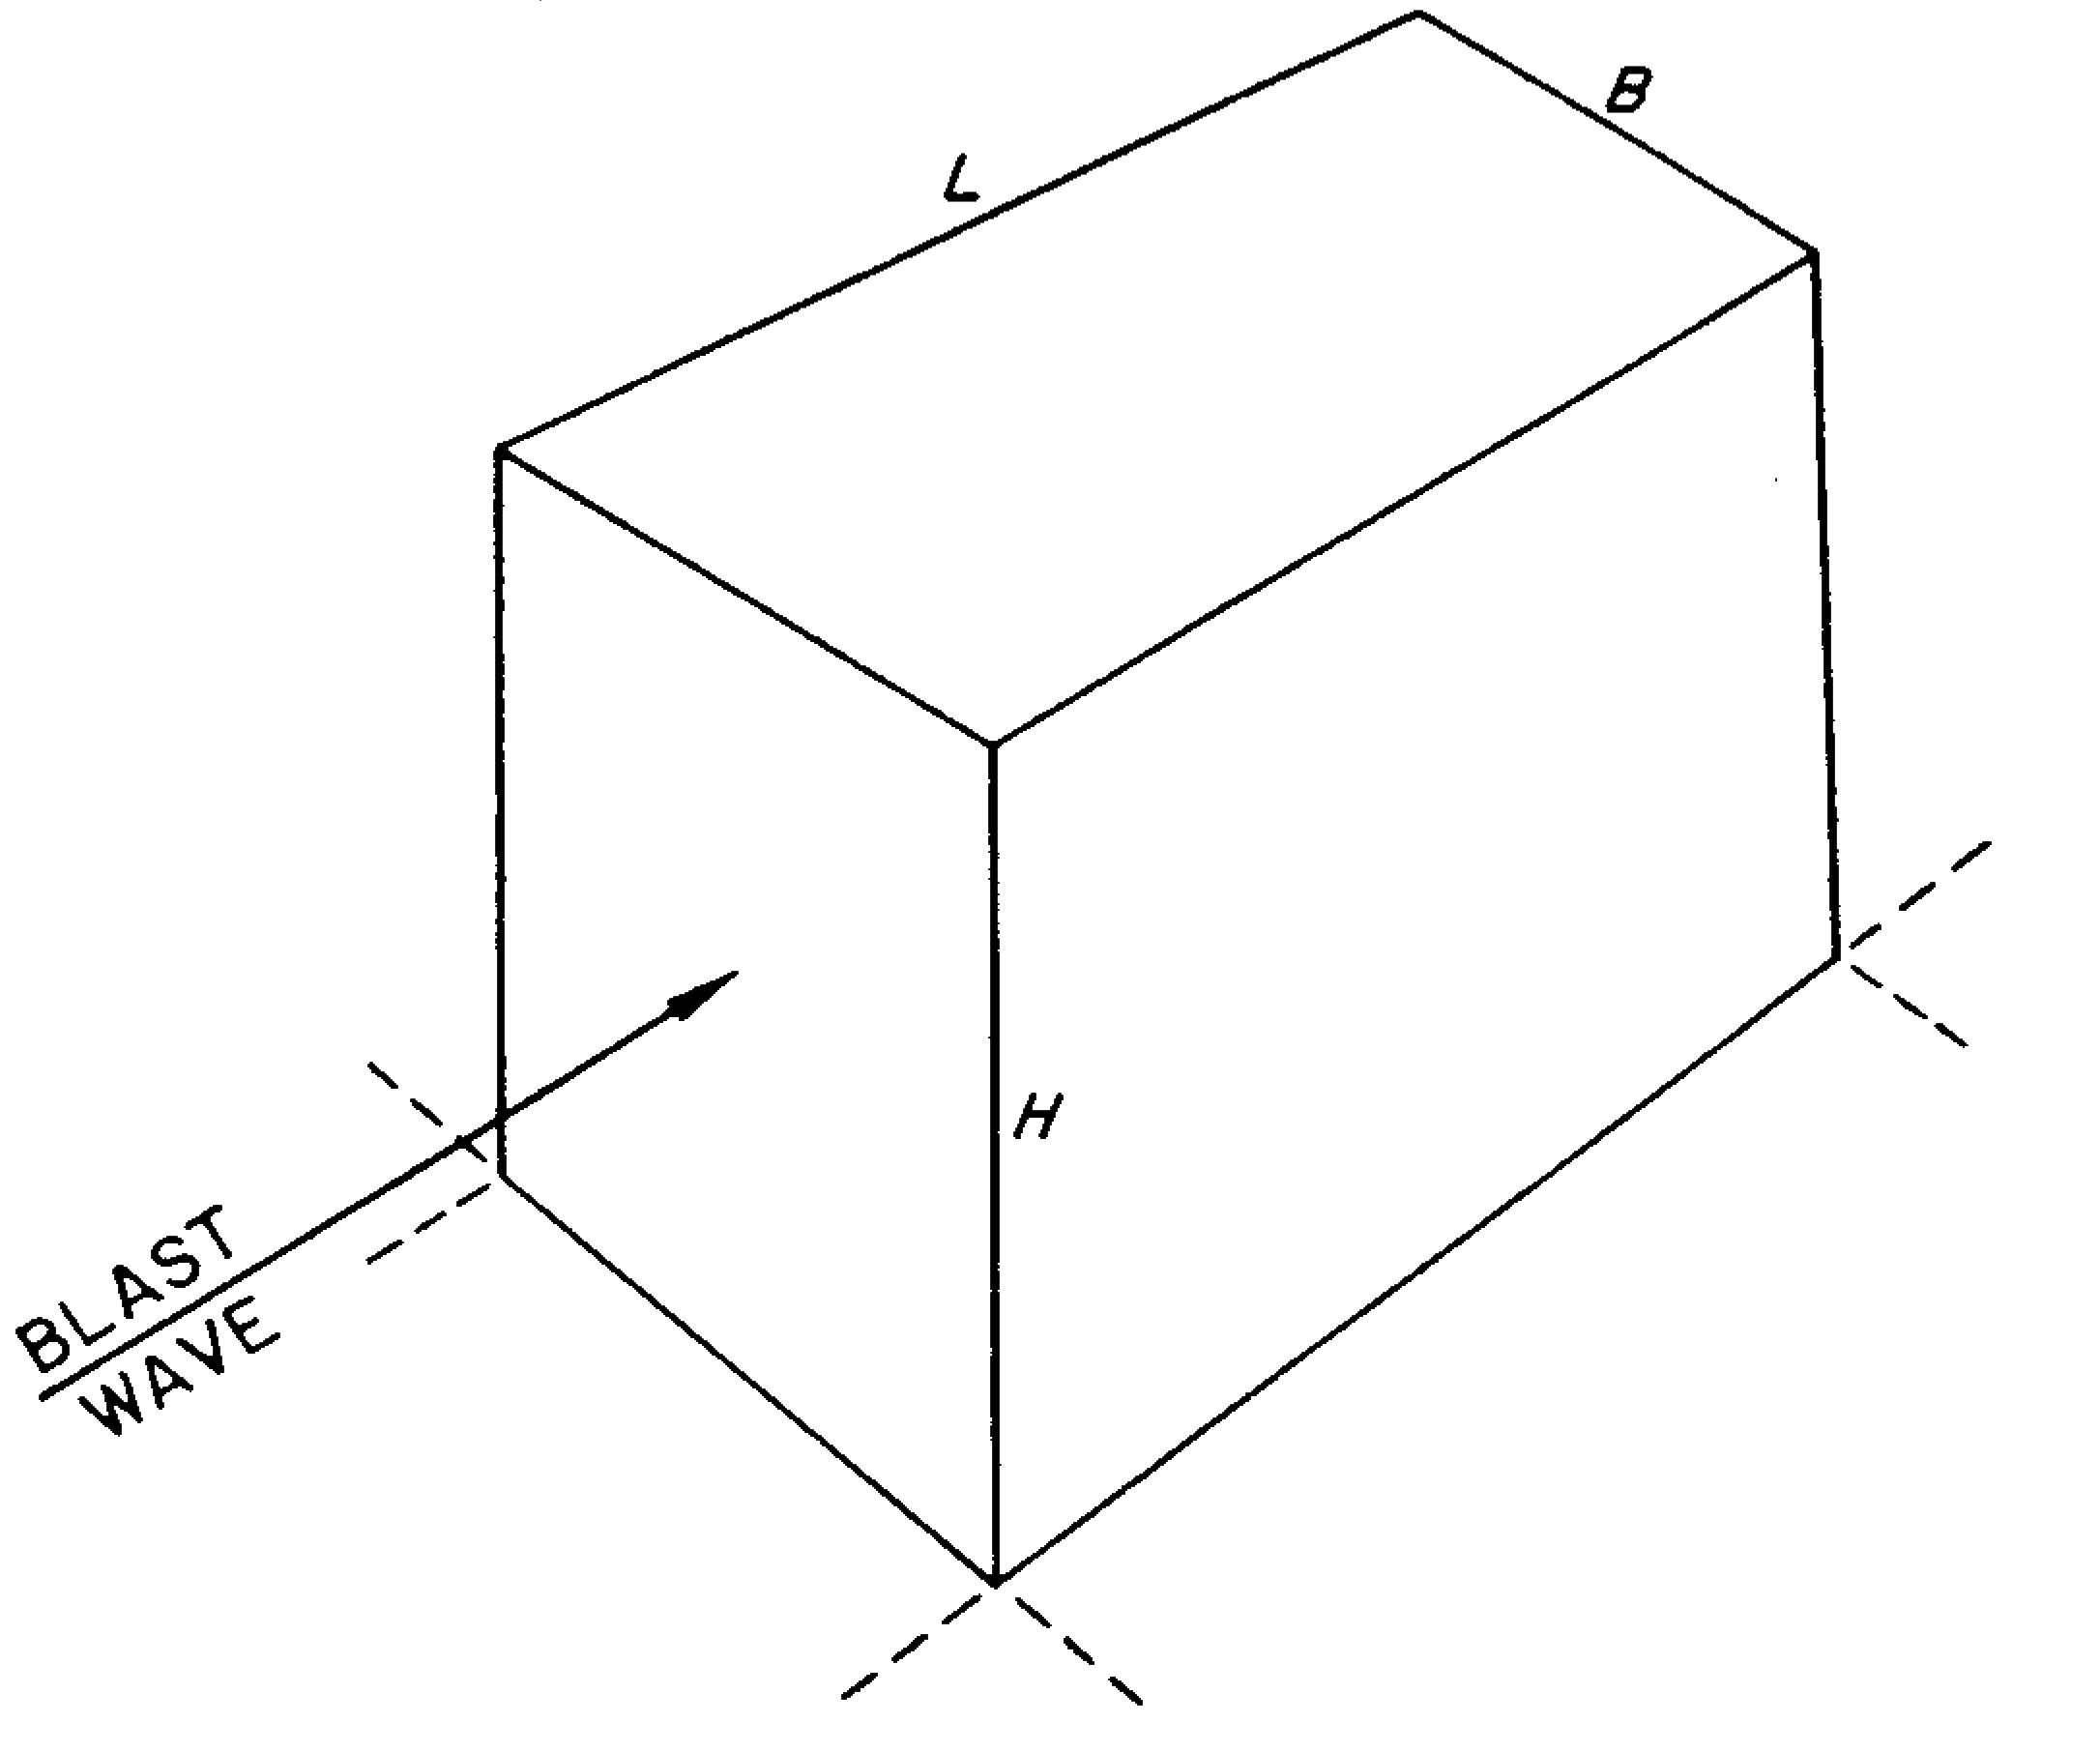
4.41 A closed box-like structure may be represented simply by a parallelepiped, as in Fig. 4.41, having a length , height , and breadth . Structures with a flat roof and walls of approximately the same blast resistance as the frame will fall into this category. The walls have either no openings (doors and windows), or a small number of such openings up to about 5 percent of the total area. The pressures on the interior of the structure then remain near the ambient value existing before the arrival of the blast wave, while the outside is subjected to blast loading. To simplify the treatment, it will be supposed that one side of the structure faces toward the explosion and is perpendicular to the direction of propagation of the blast wave. This side is called the front face. The loading diagrams are computed below for (a) the front face, (b) the side and top, and (c) the back face. By combining the data for (a) and (c), the net horizontal loading is obtained in (d).
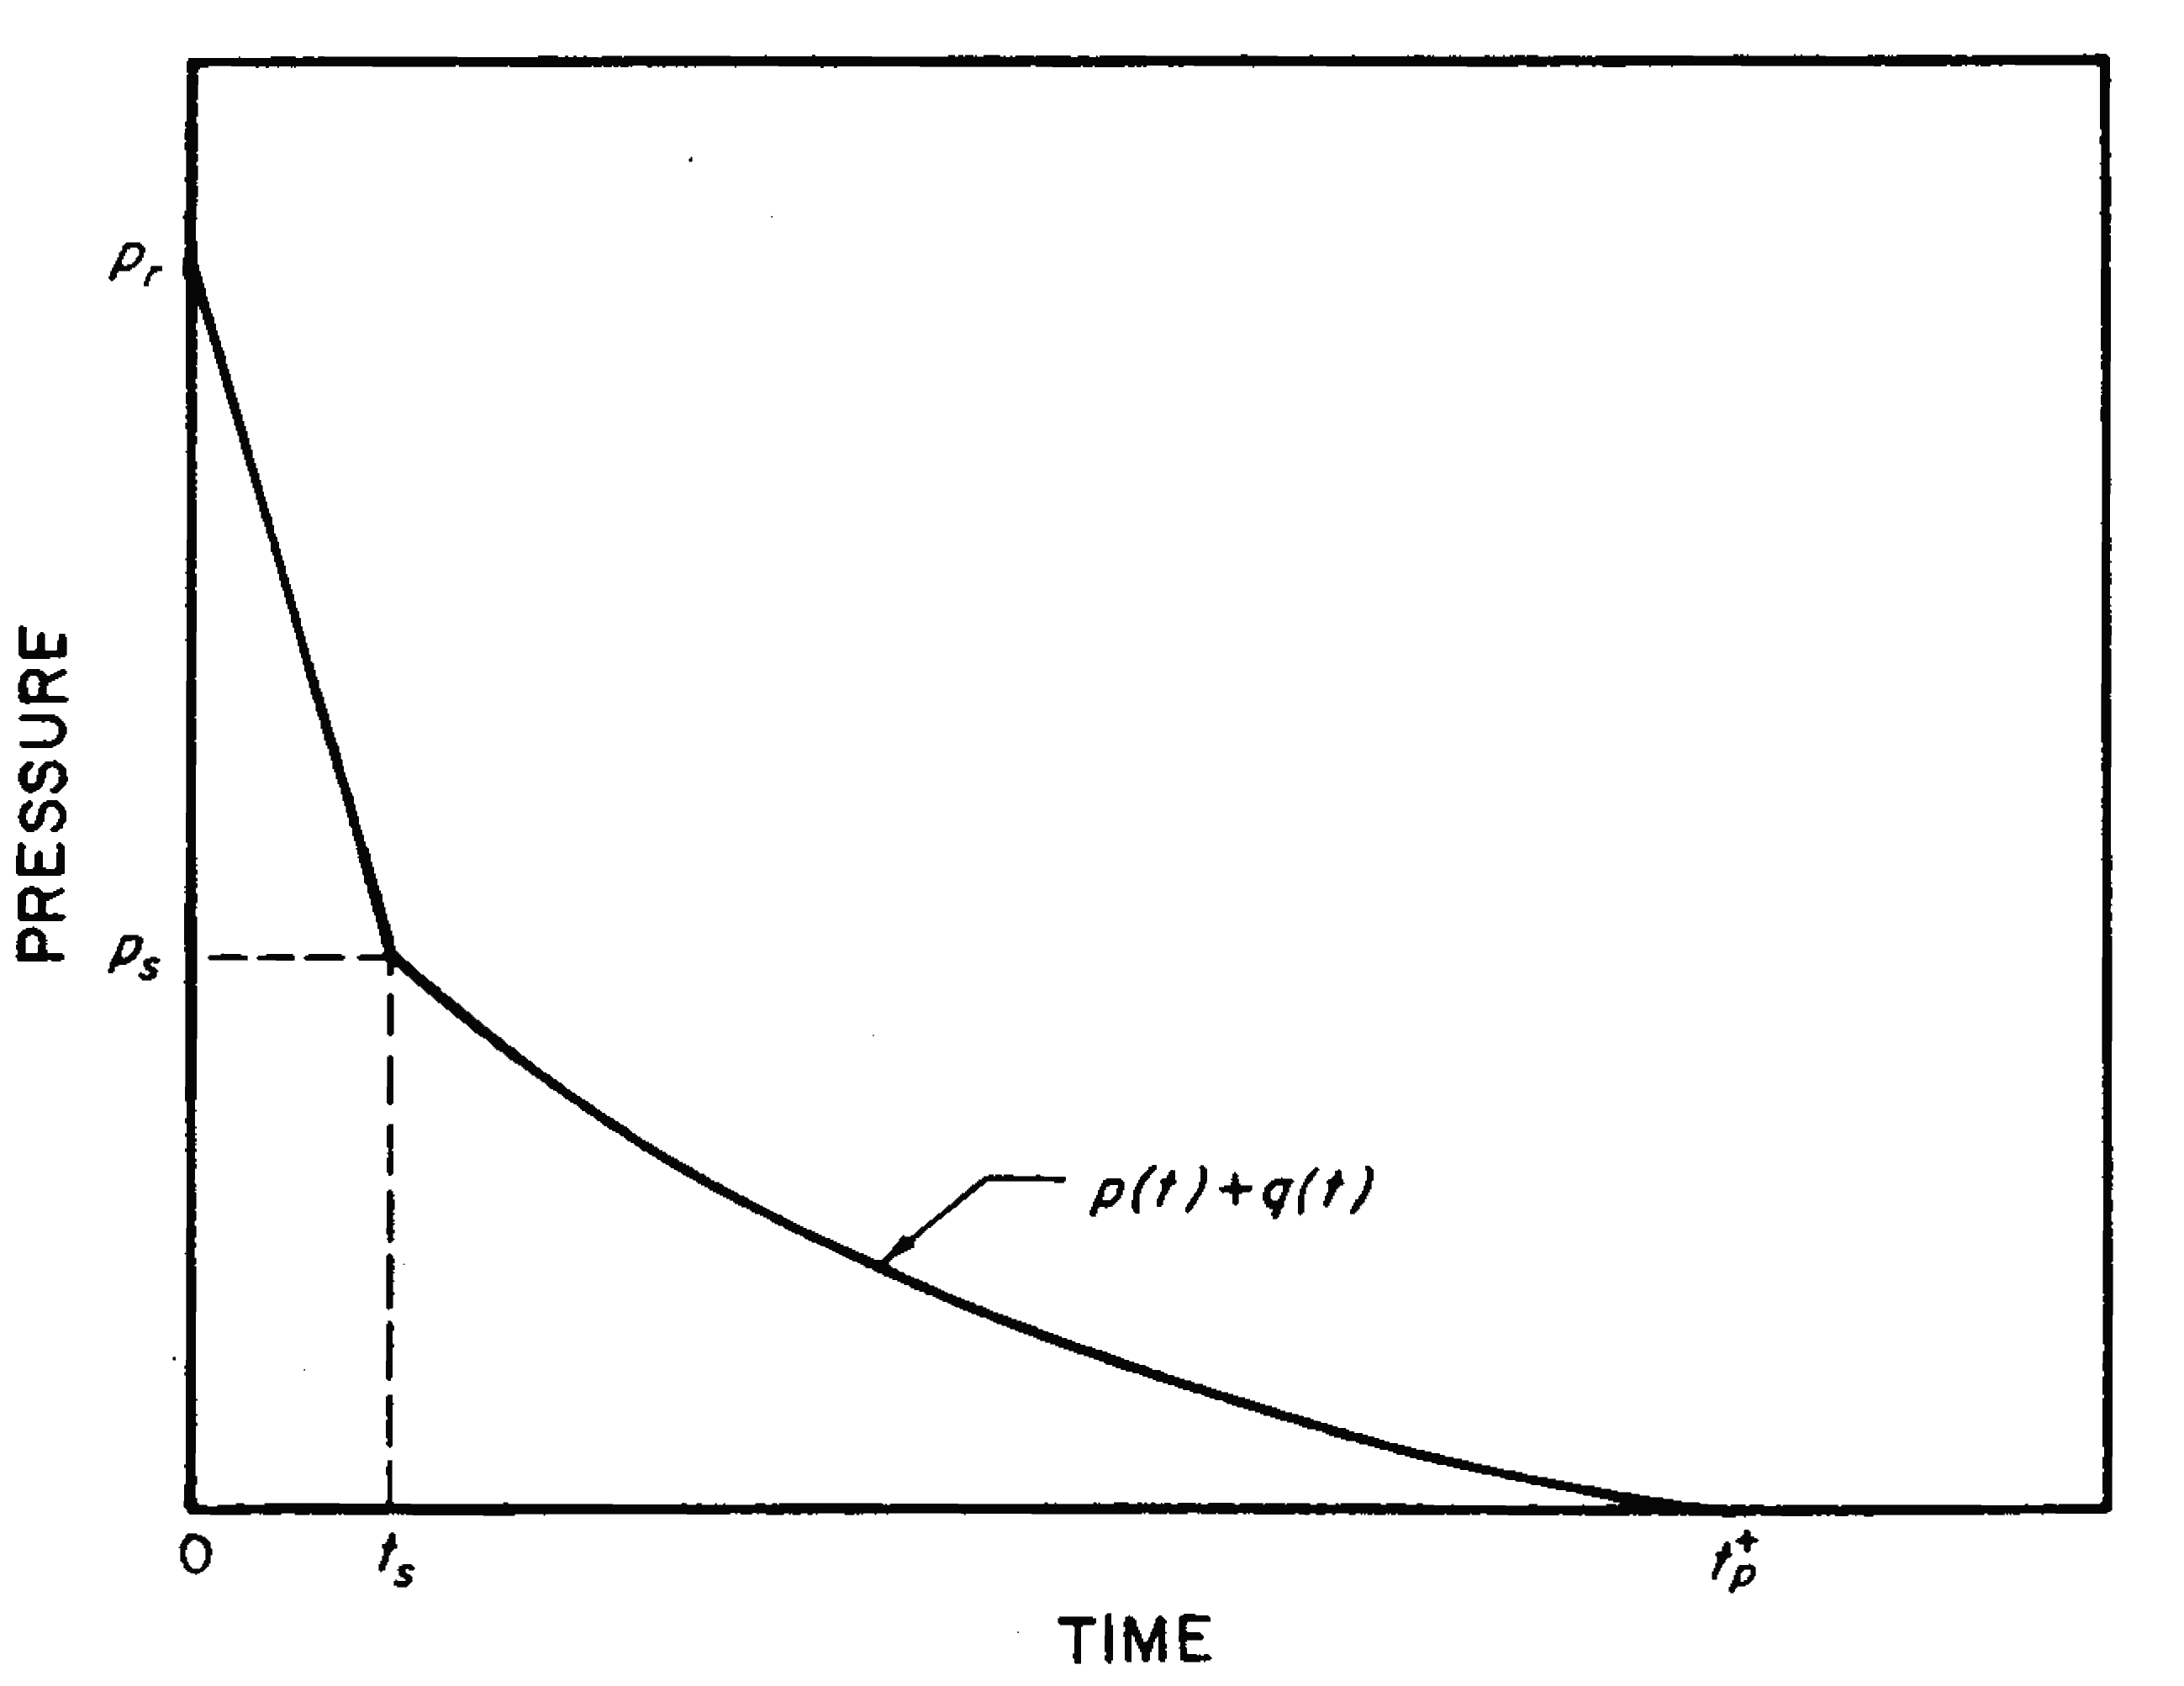
4.42 (a) Average Loading on Front Face.—The first step is to determine the reflected pressure, ; this gives the pressure at the time = 0, when the blast wave front strikes the front face (Fig. 4.42). Next, the time, , is calculated at which the stagnation pressure, , is first attained. It has been found from laboratory studies that, for peak overpressures being considered (50 pounds per square inch or less), can be represented, to a good approximation, by
where is equal to or , whichever is less, and is the blast front (shock) velocity. The drag coefficient for the front face is unity, so that the drag pressure is here equal to the dynamic pressure. The stagnation pressure is thus
where and are the overpressure and dynamic pressure at the time . The average pressure subsequently decays with time, so that,
where is any time between and . The pressure-time curve for the front face can thus be determined, as in Fig. 4.42.
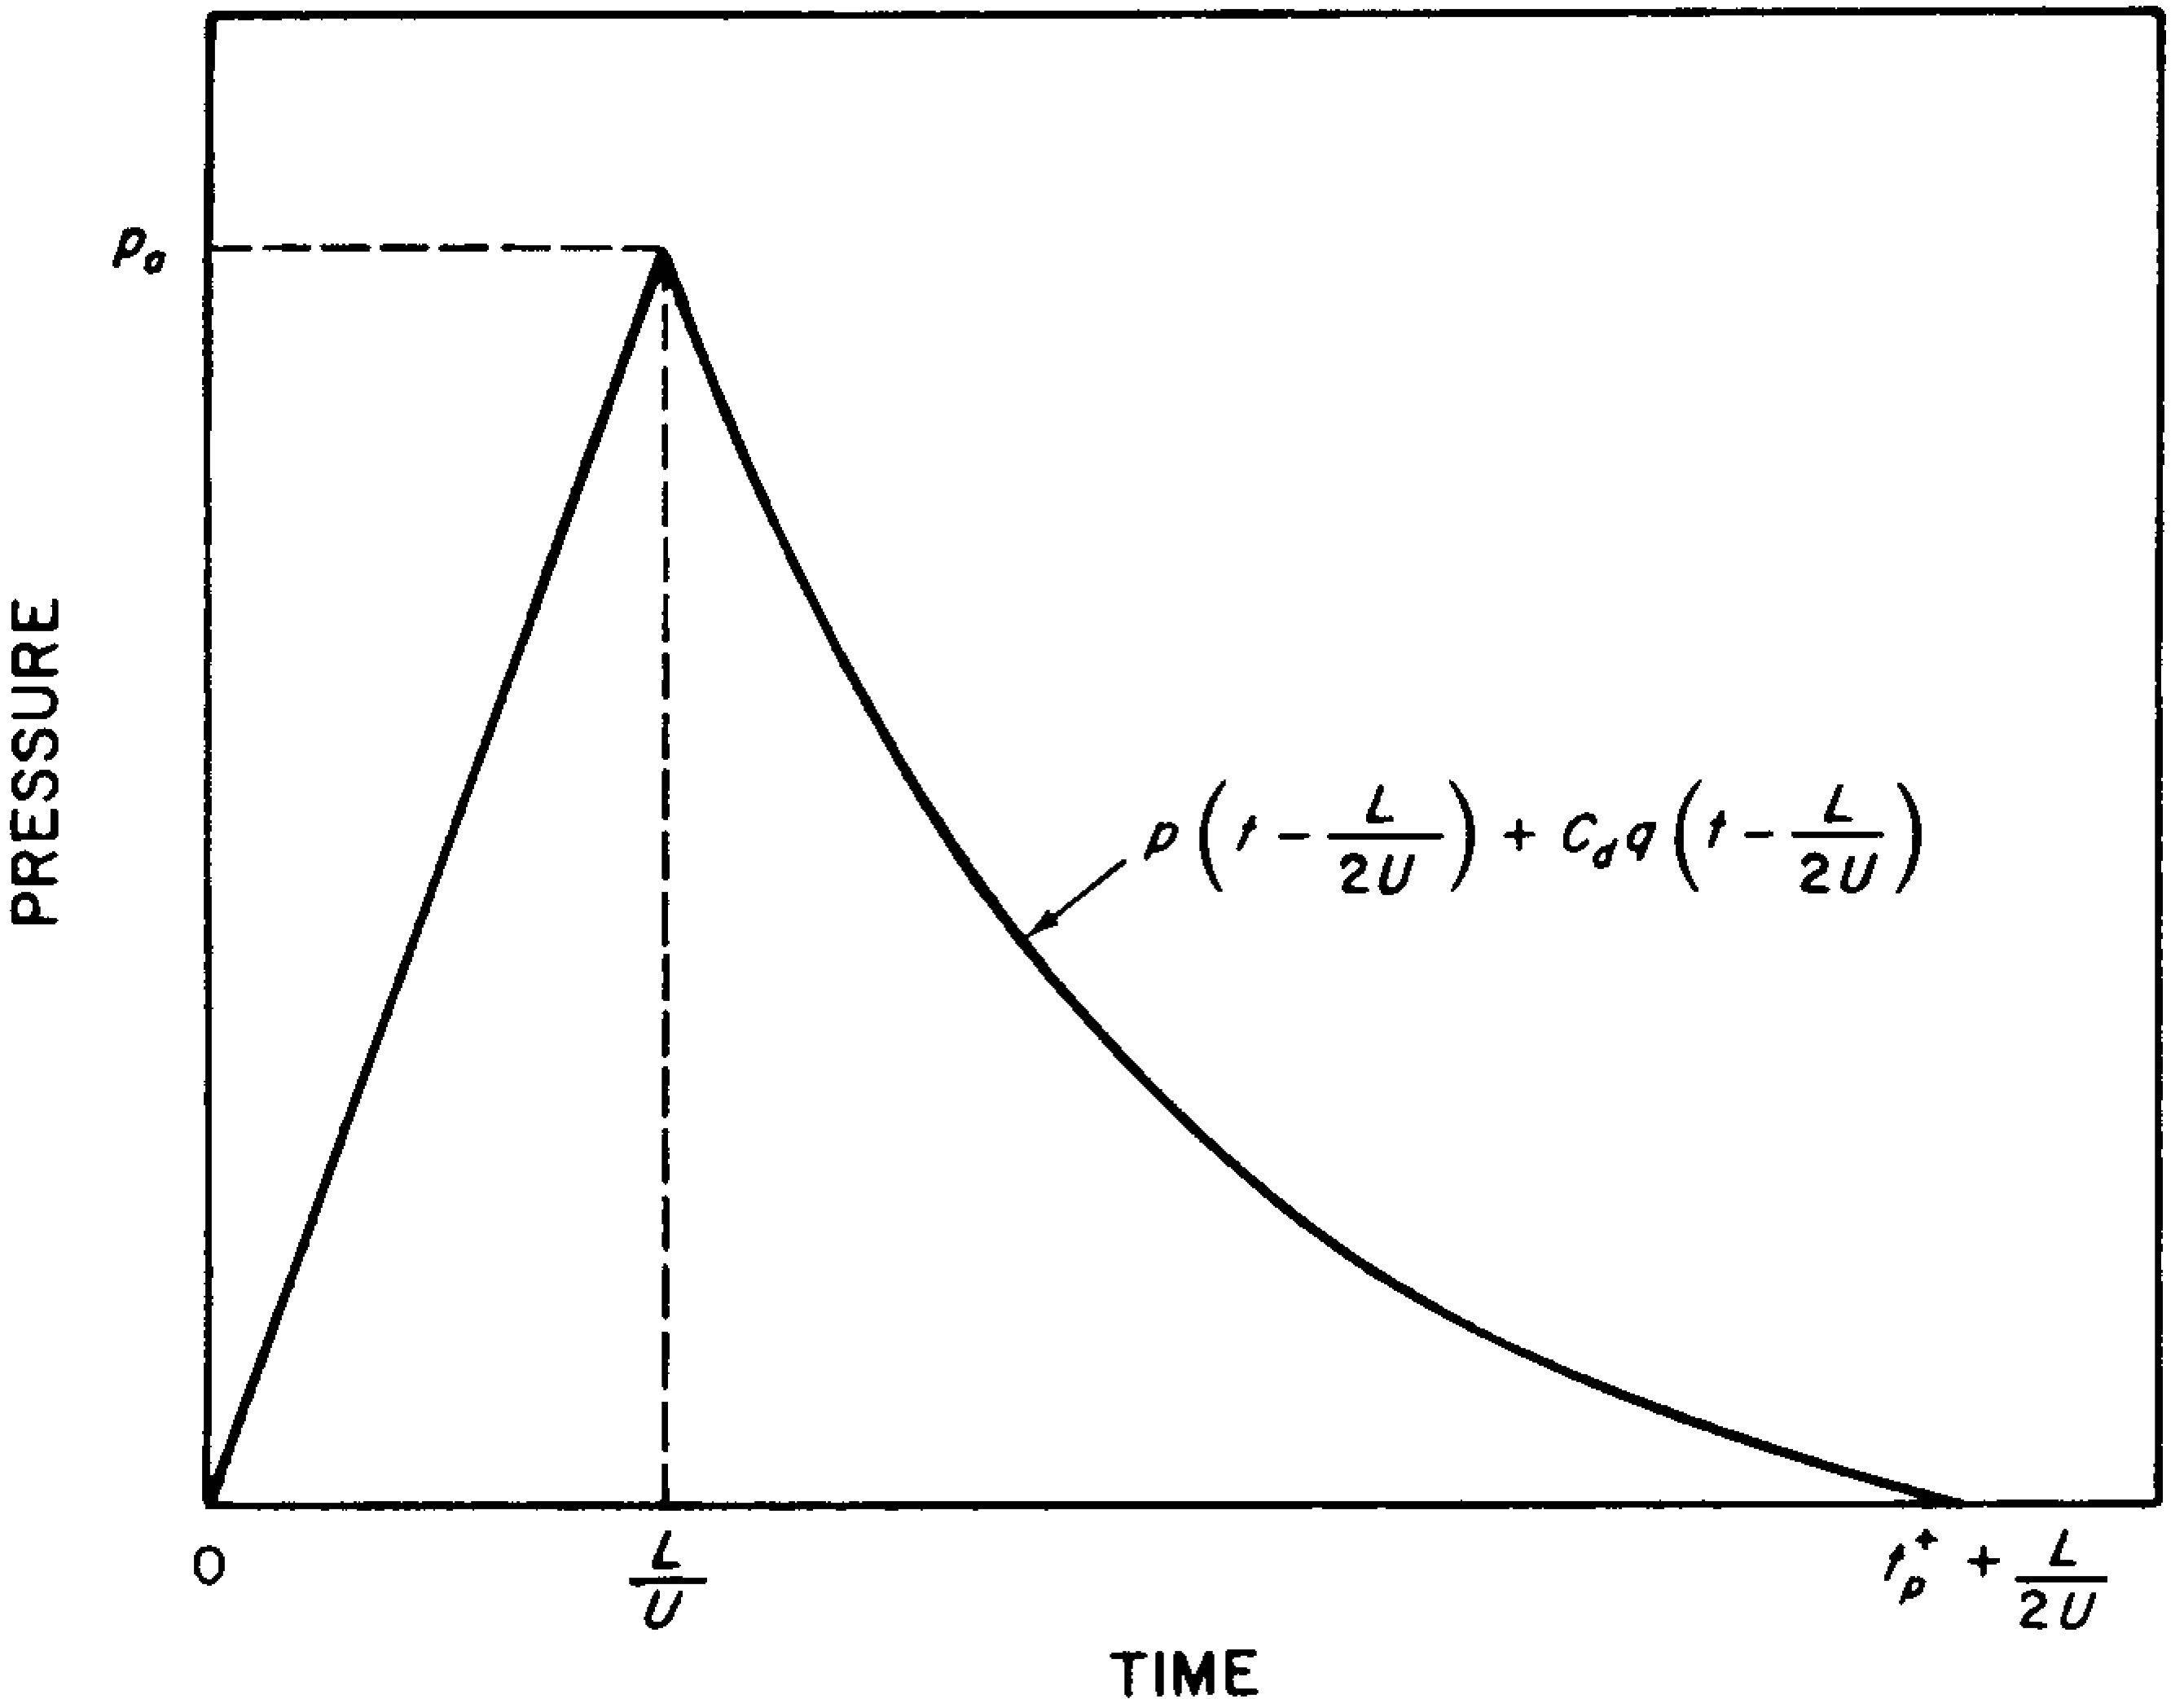
4.43 (b) Average Loading on Sides and Top.—Although loading commences immediately after the blast wave strikes the front face, i.e., at , the sides and top are not fully loaded until the wave has traveled the distance , i.e., at times . The average pressure, , at this time is considered to be the overpressure plus the drag loading at the distance from the front of the structure, so that
The drag coefficient on the sides and top of the structure is approximately -0.4 for the blast pressure range under consideration (§ 4.23). The loading increases from zero at to the value at the time , as shown in Fig. 4.43. Subsequently, the average pressure at any time is given by
where lies between and , as seen in Fig. 4.43. The overpressure and dynamic pressure, respectively, are the values at the time . Hence, the overpressure on the sides and top becomes zero at time .
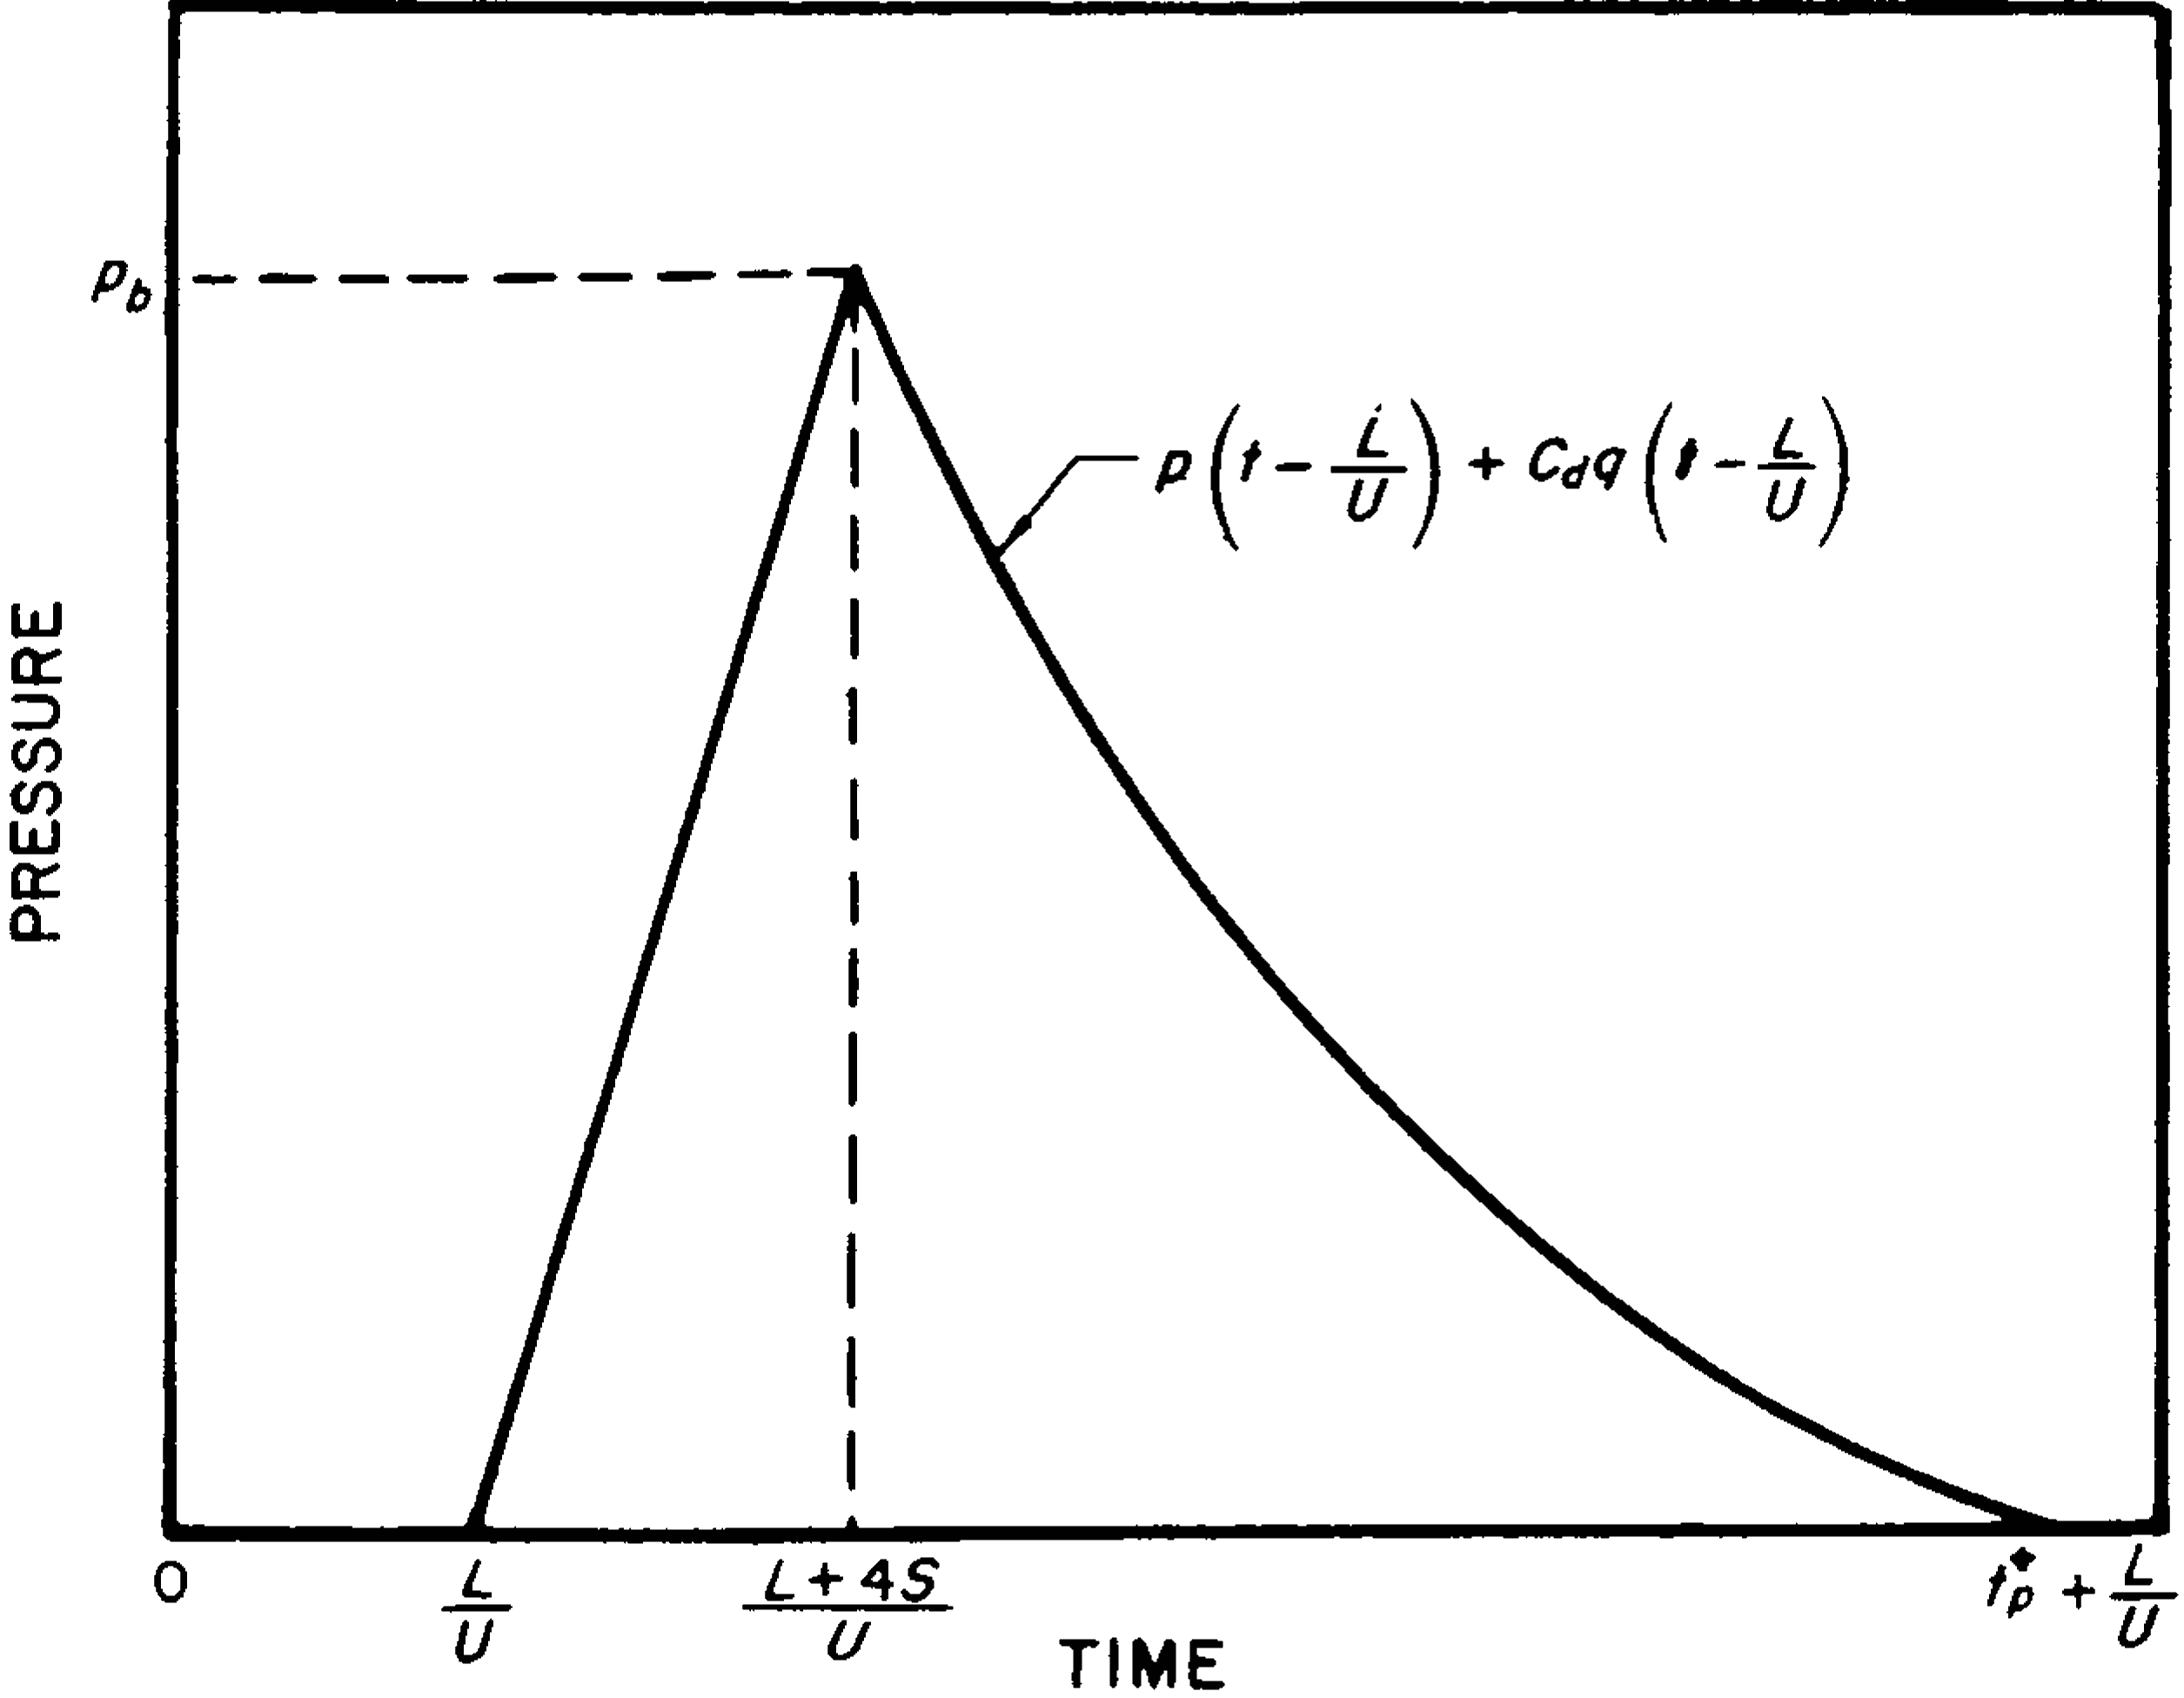
4.44 (c) Average Loading on Back Face.—The shock front arrives at the back face at time LIU, but it requires an additional time, 4S/U, for the average pressure to build up to the value pb (Fig. 4.44), where pb is given approximately by
Here, as before, Sis equal to Hor B/2 whichever is the smaller. The drag coefficient on the back face is about -0.3 for the postulated blast pressure range. The average pressure at any time t after the attainment of pb is represented by
where lies between and , as seen in Fig. 4.44.
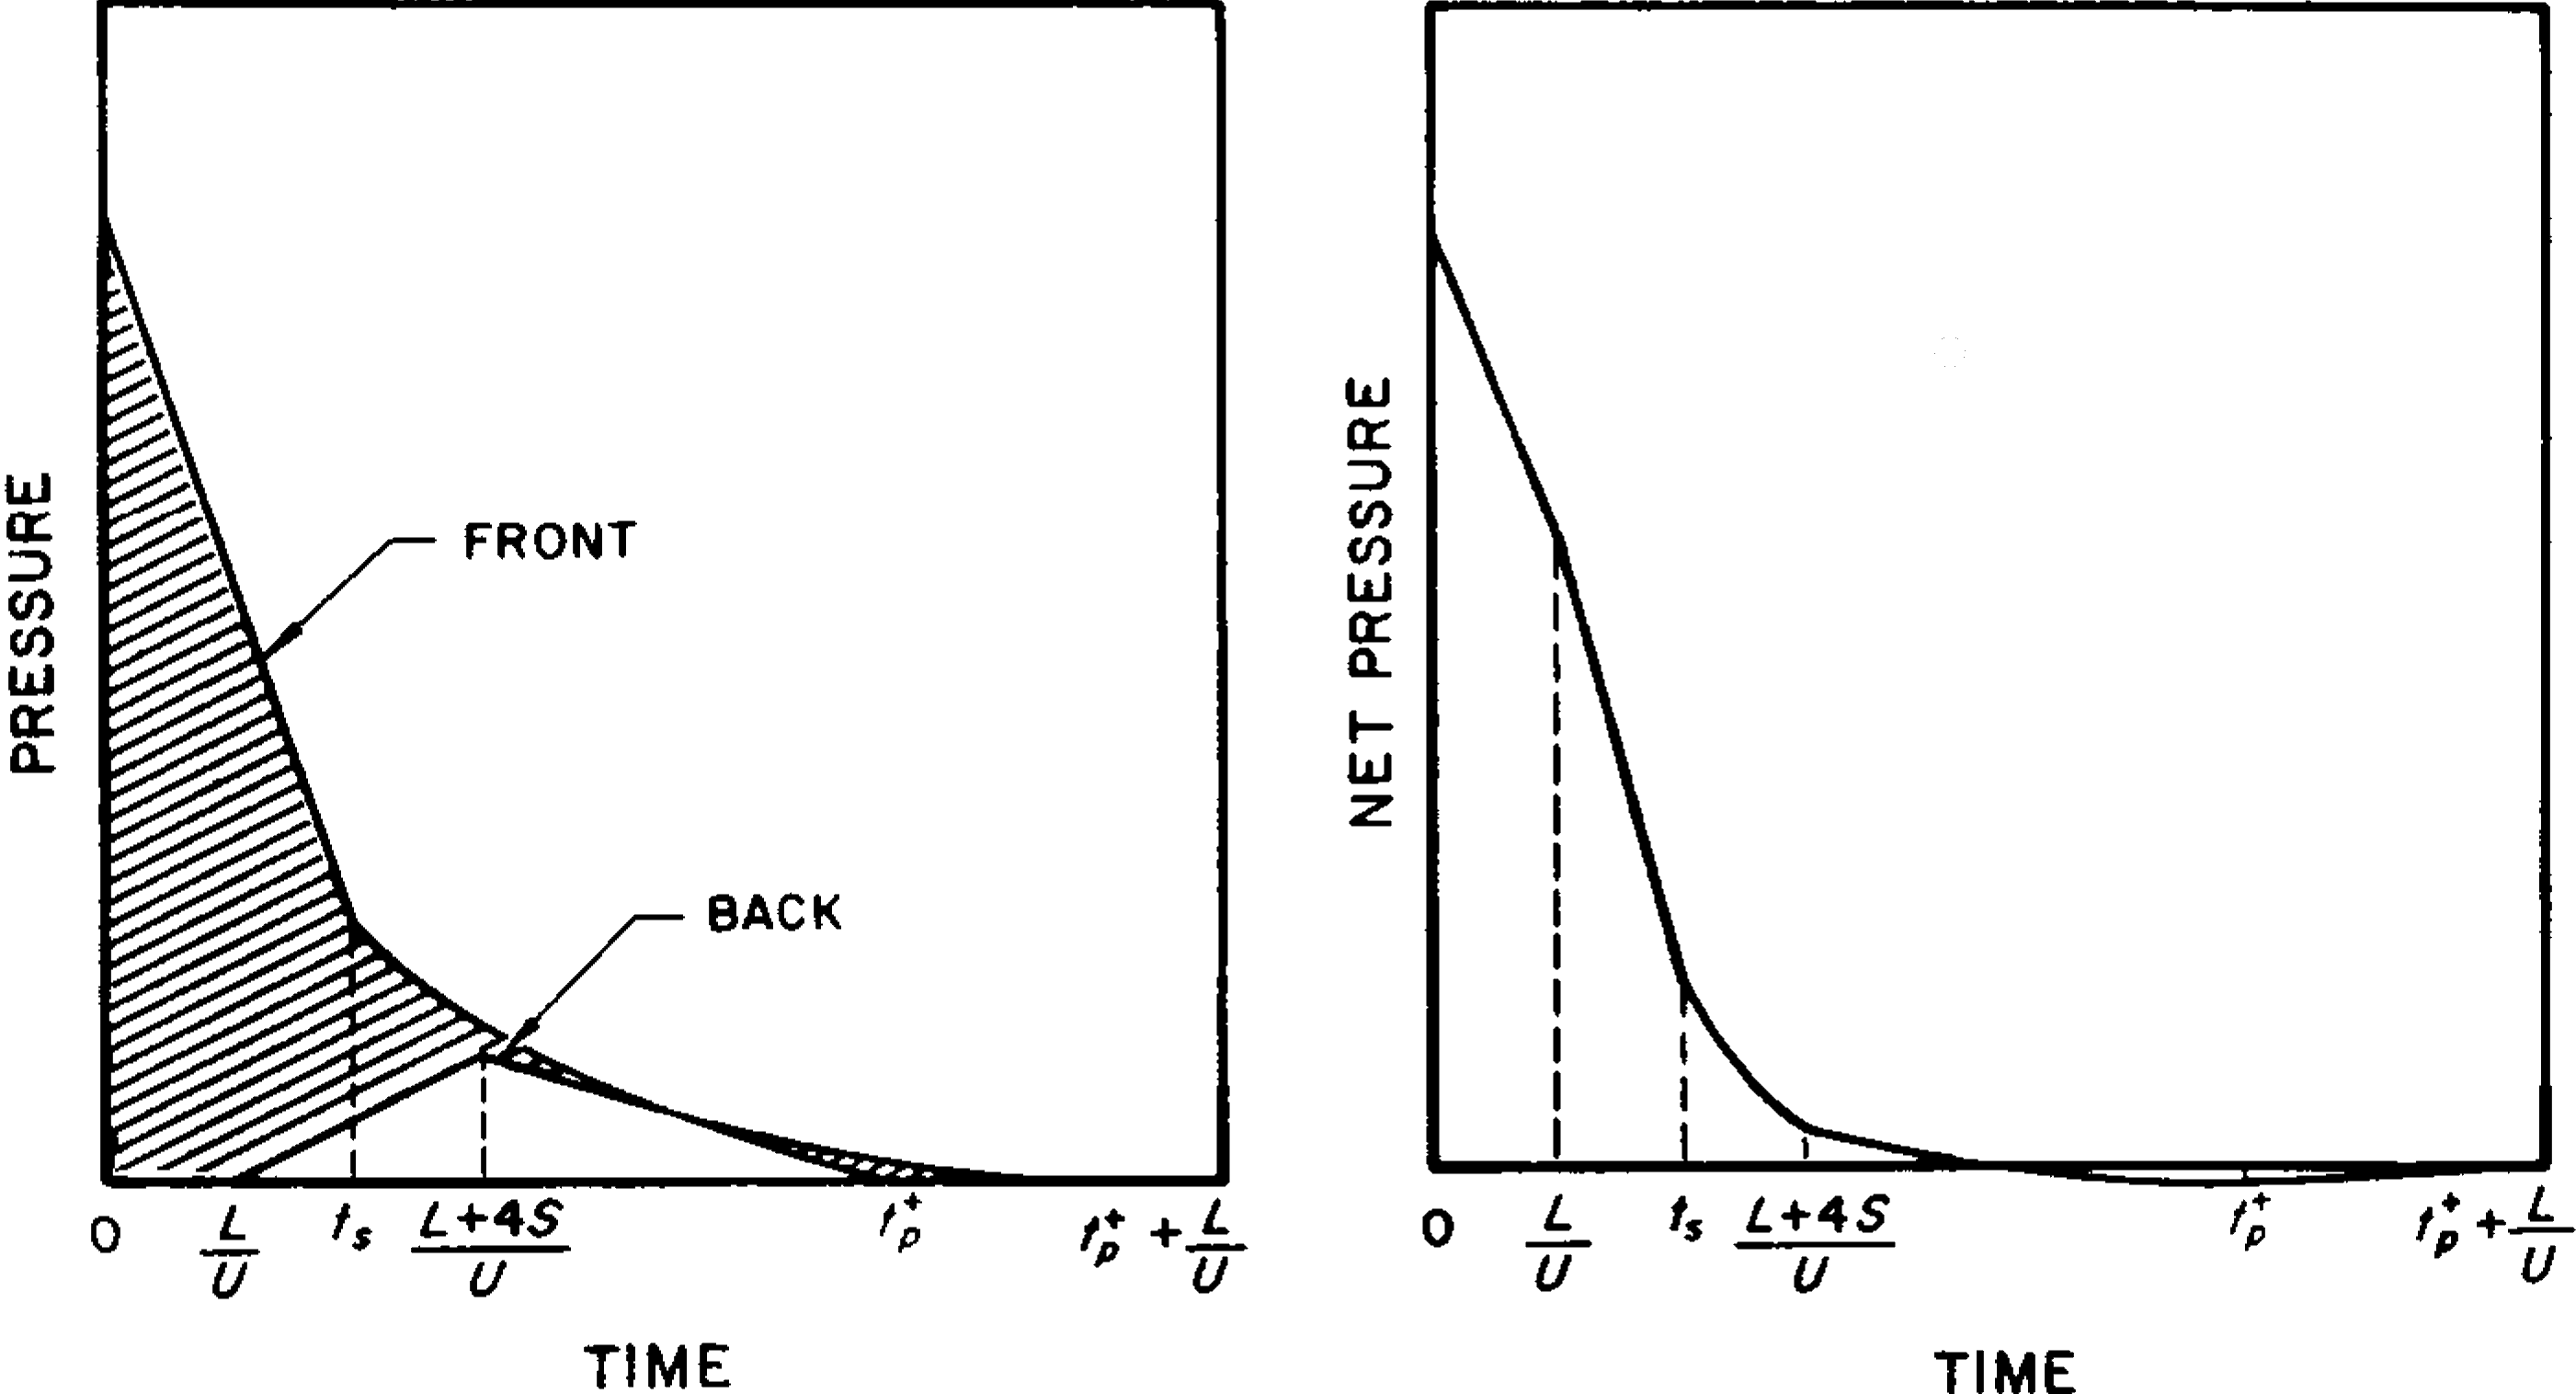
4.45 (d) Net Horizontal Loading.—The net loading is equal to the front loading minus the back loading. This subtraction is best performed graphically, as shown in Fig. 4.45. The left-hand diagram gives the individual front and back loading curves, as derived from Figs. 4.42 and 4.44, respectively. The difference indicated by the shaded region is then transferred to the right-hand diagram to give the net pressure. The net loading is necessary for determining the frame response, whereas the wall actions are governed primarily by the loadings on the individual faces.
PARTIALLY OPEN BOX-LIKE STRUCTURES
4.46 A partially open box-like structure is one in which the front and back walls have about 30 percent of openings or window area and no interior partitions to influence the passage of the blast wave. As in the previous case, the loading is derived for (a) the front face, (b) the sides and roof, (c) the back face, and (d) the net horizontal loading. Because the blast wave can now enter the inside of the structure, the loading-time curves must be considered for both the exterior and interior of the structure.
4.47 (a) Average Loading on Front Face.—The outside loading is computed in the same manner as that used for a closed structure, except that is replaced by . The quantity is the average distance (for the entire front face) from the center of a wall section to an open edge of the wall. It represents the average distance which rarefaction waves must travel on the front face to reduce the reflected pressures to the stagnation pressure.
4.48 The pressure on the inside of the front face starts rising at zero time, because the blast wave immediately enters through the openings, but it takes a time to reach the blast wave overpressure value. Subsequently, the inside pressure at any time is given by . The dynamic pressures are assumed to be negligible on the interior of the structure. The variations of the inside and the outside pressures with time are as represented in Fig. 4.48.
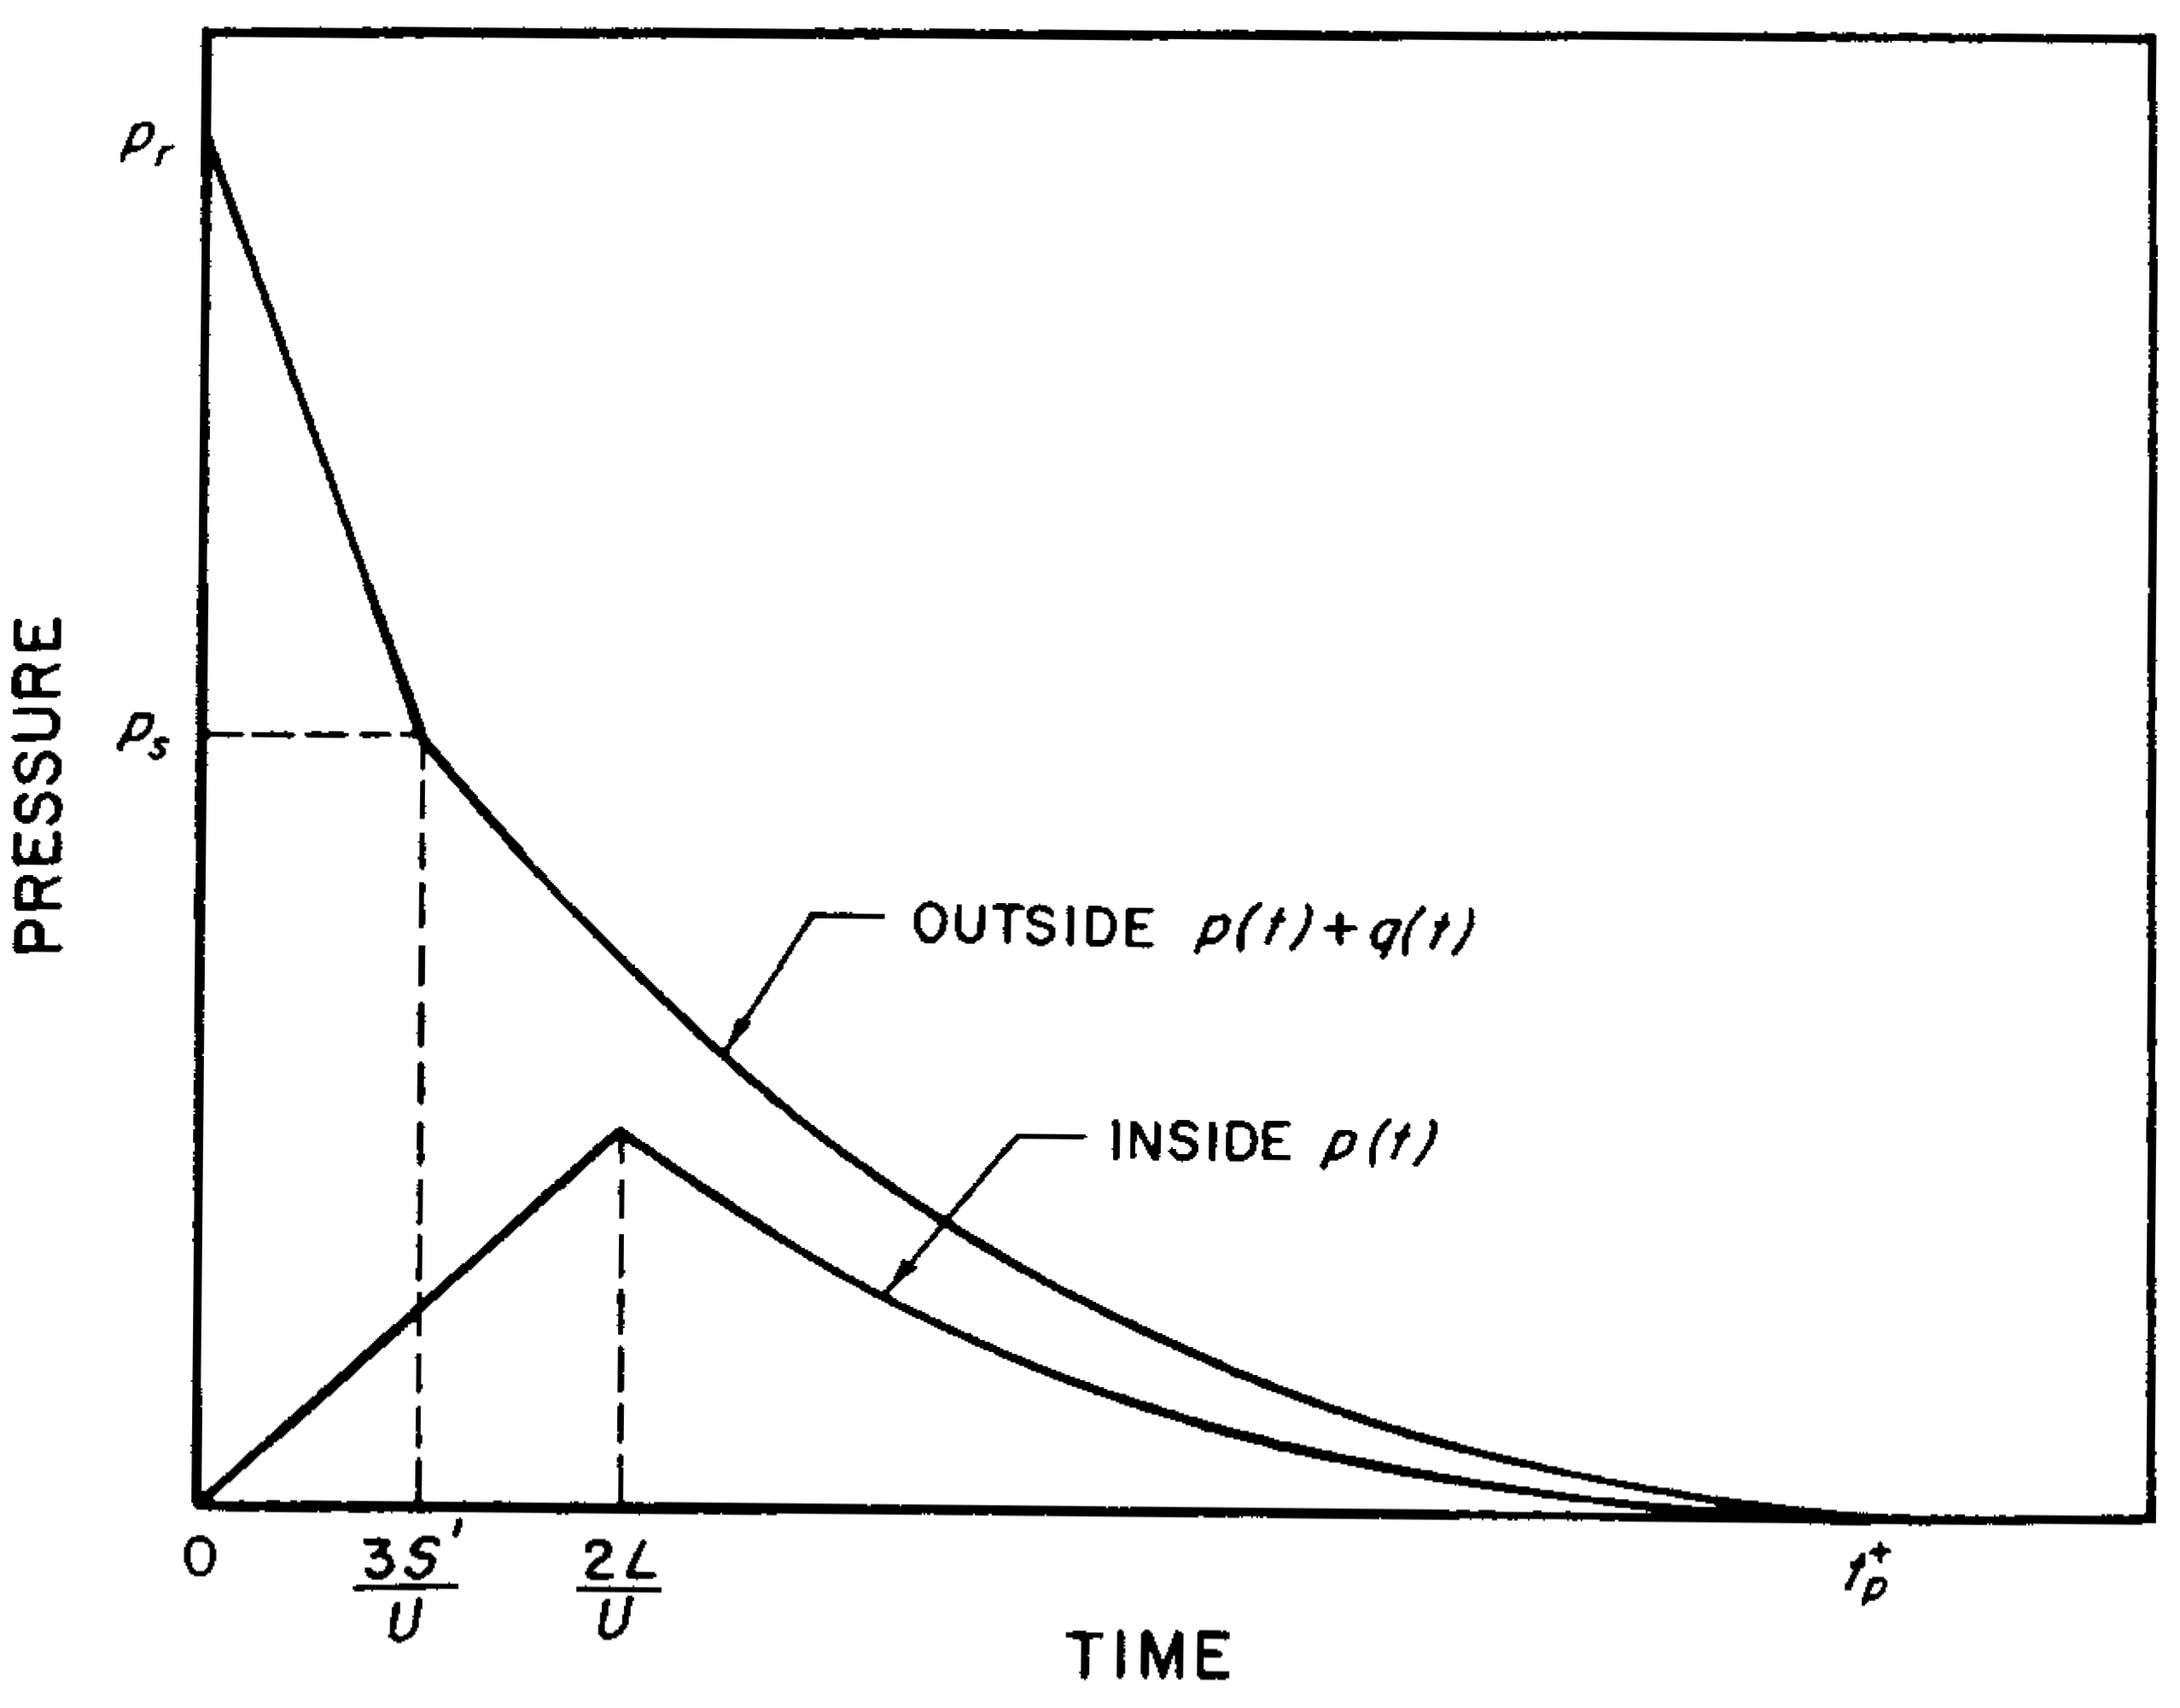
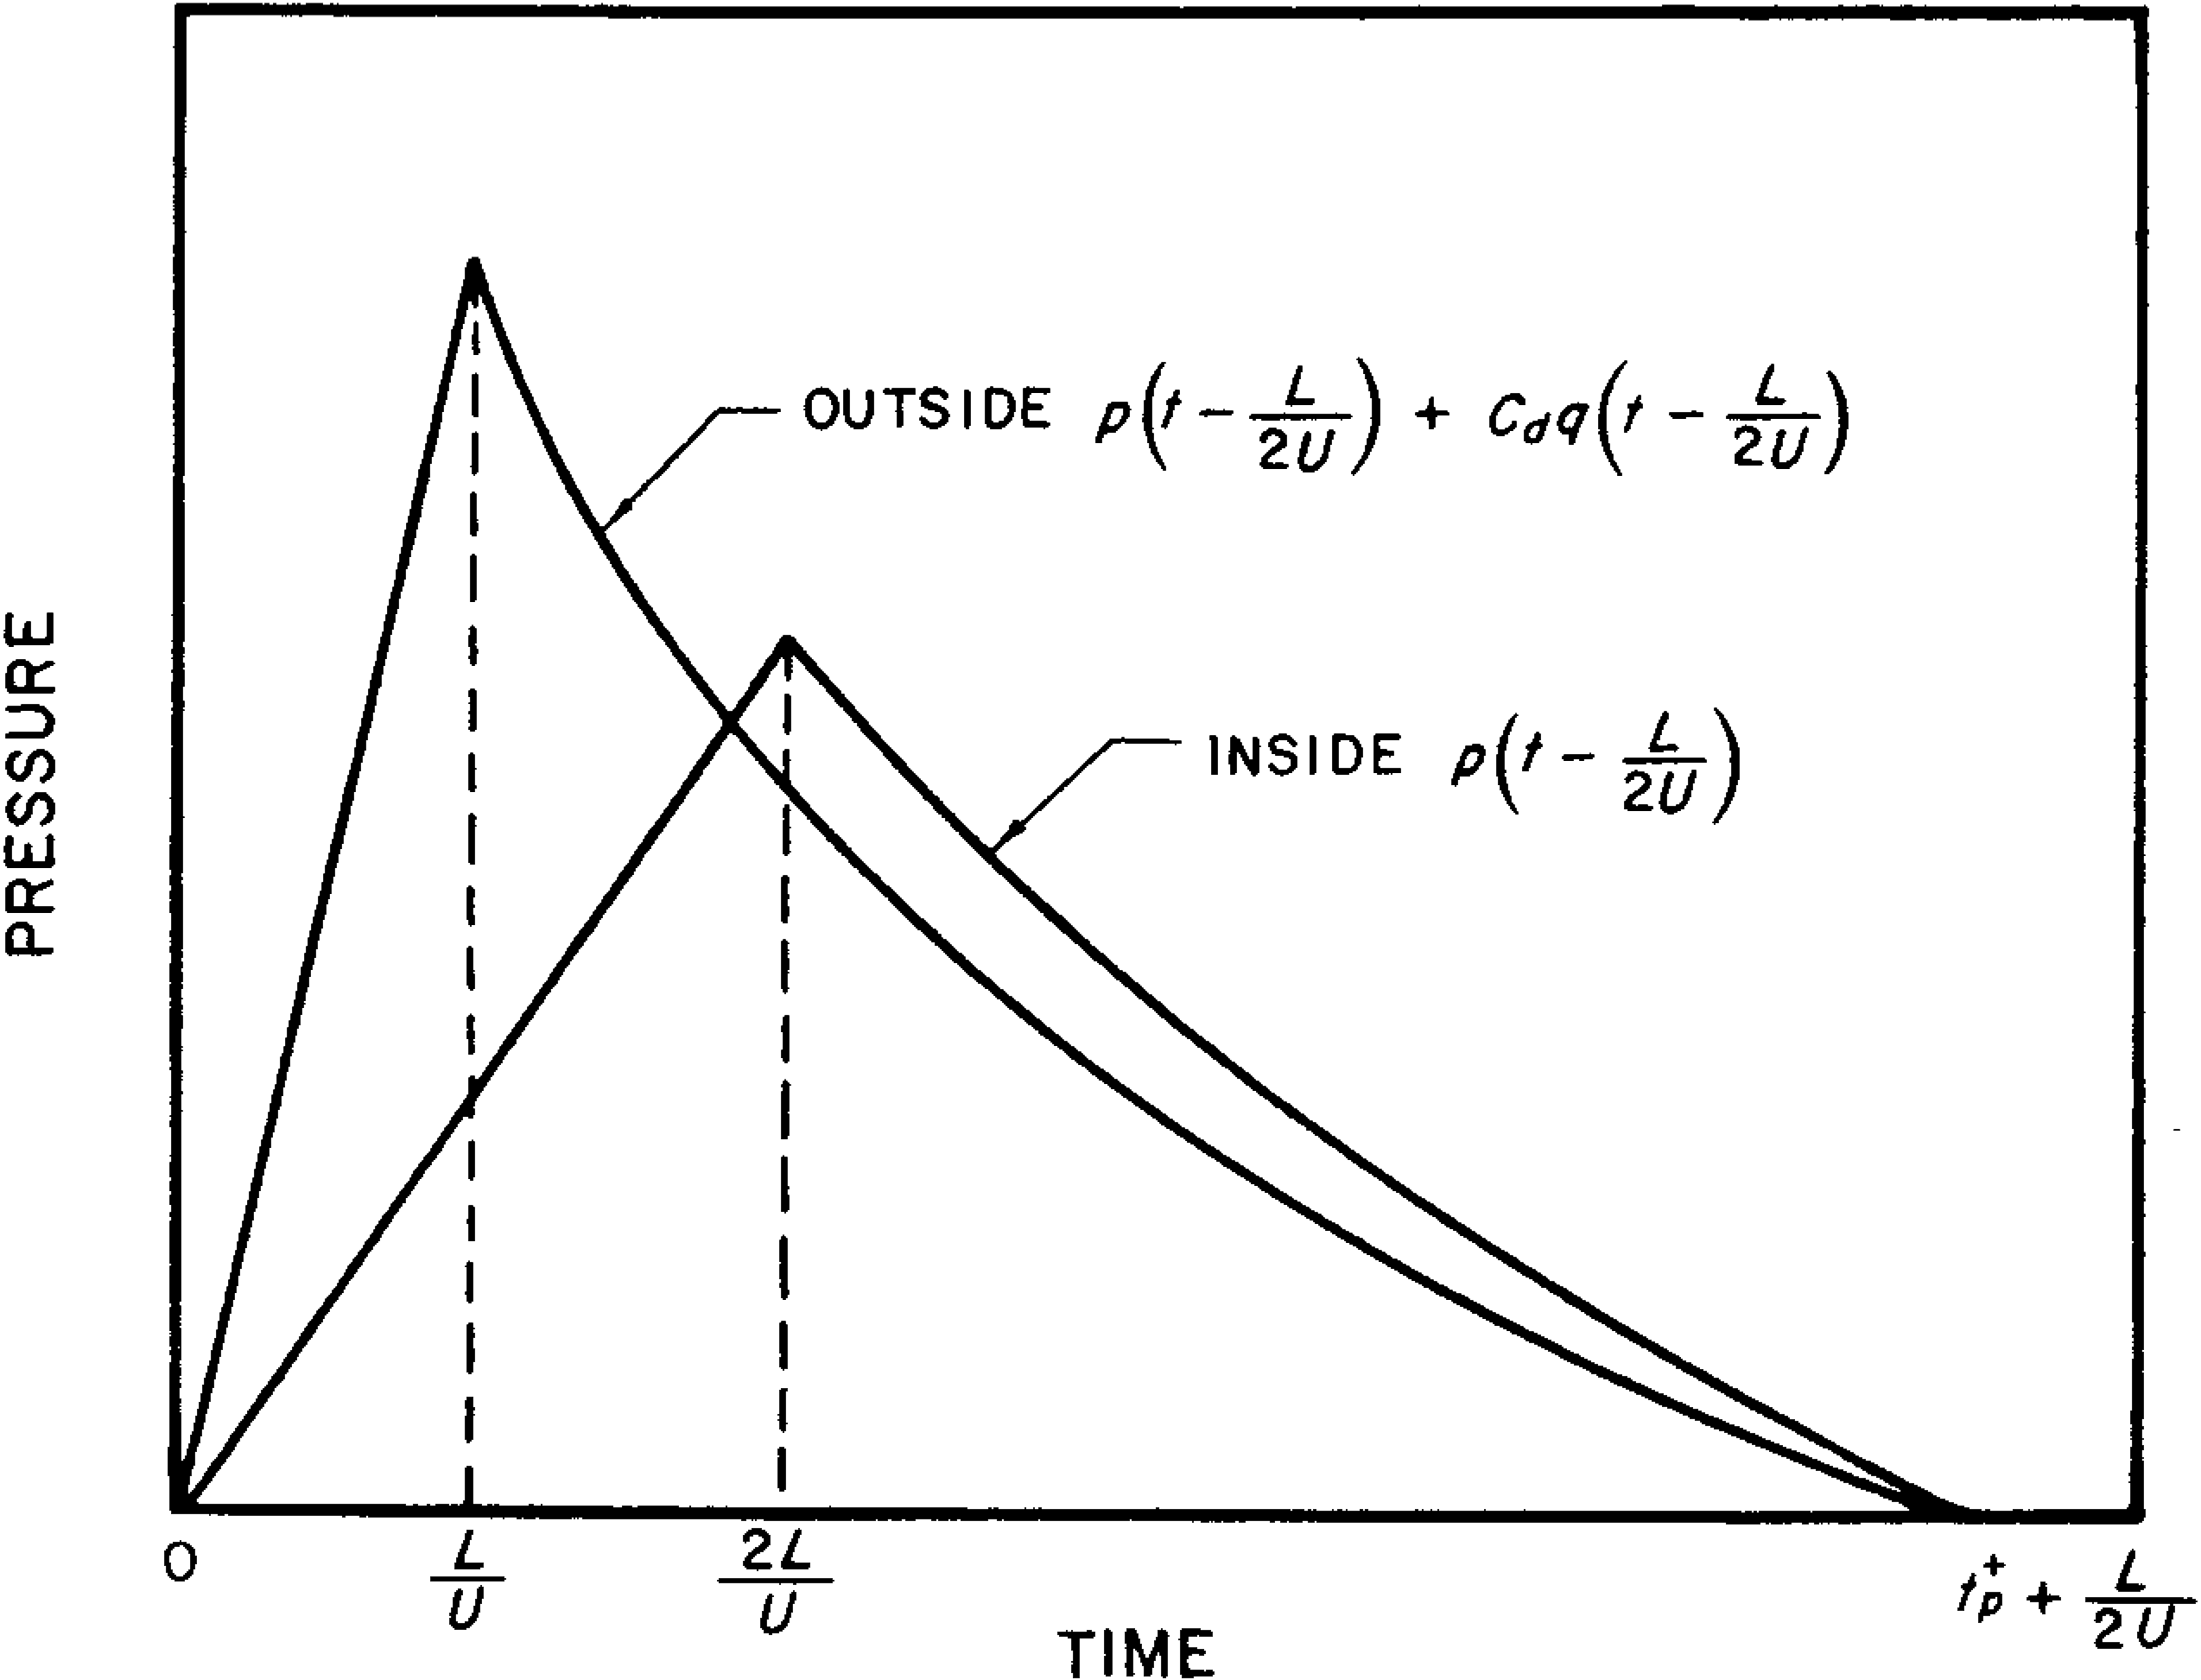
4.49 (b) Average Loading on Sides and Top.— The outside pressures are obtained as for a closed structure (§ 4.43), but the inside pressures, as for the front face, require a time to attain the overpressure in the blast wave. Here also, the dynamic pressures on the interior are neglected, and side wall openings are ignored because their effect on the loading is uncertain. The loading curves are depicted in Fig. 4.49.
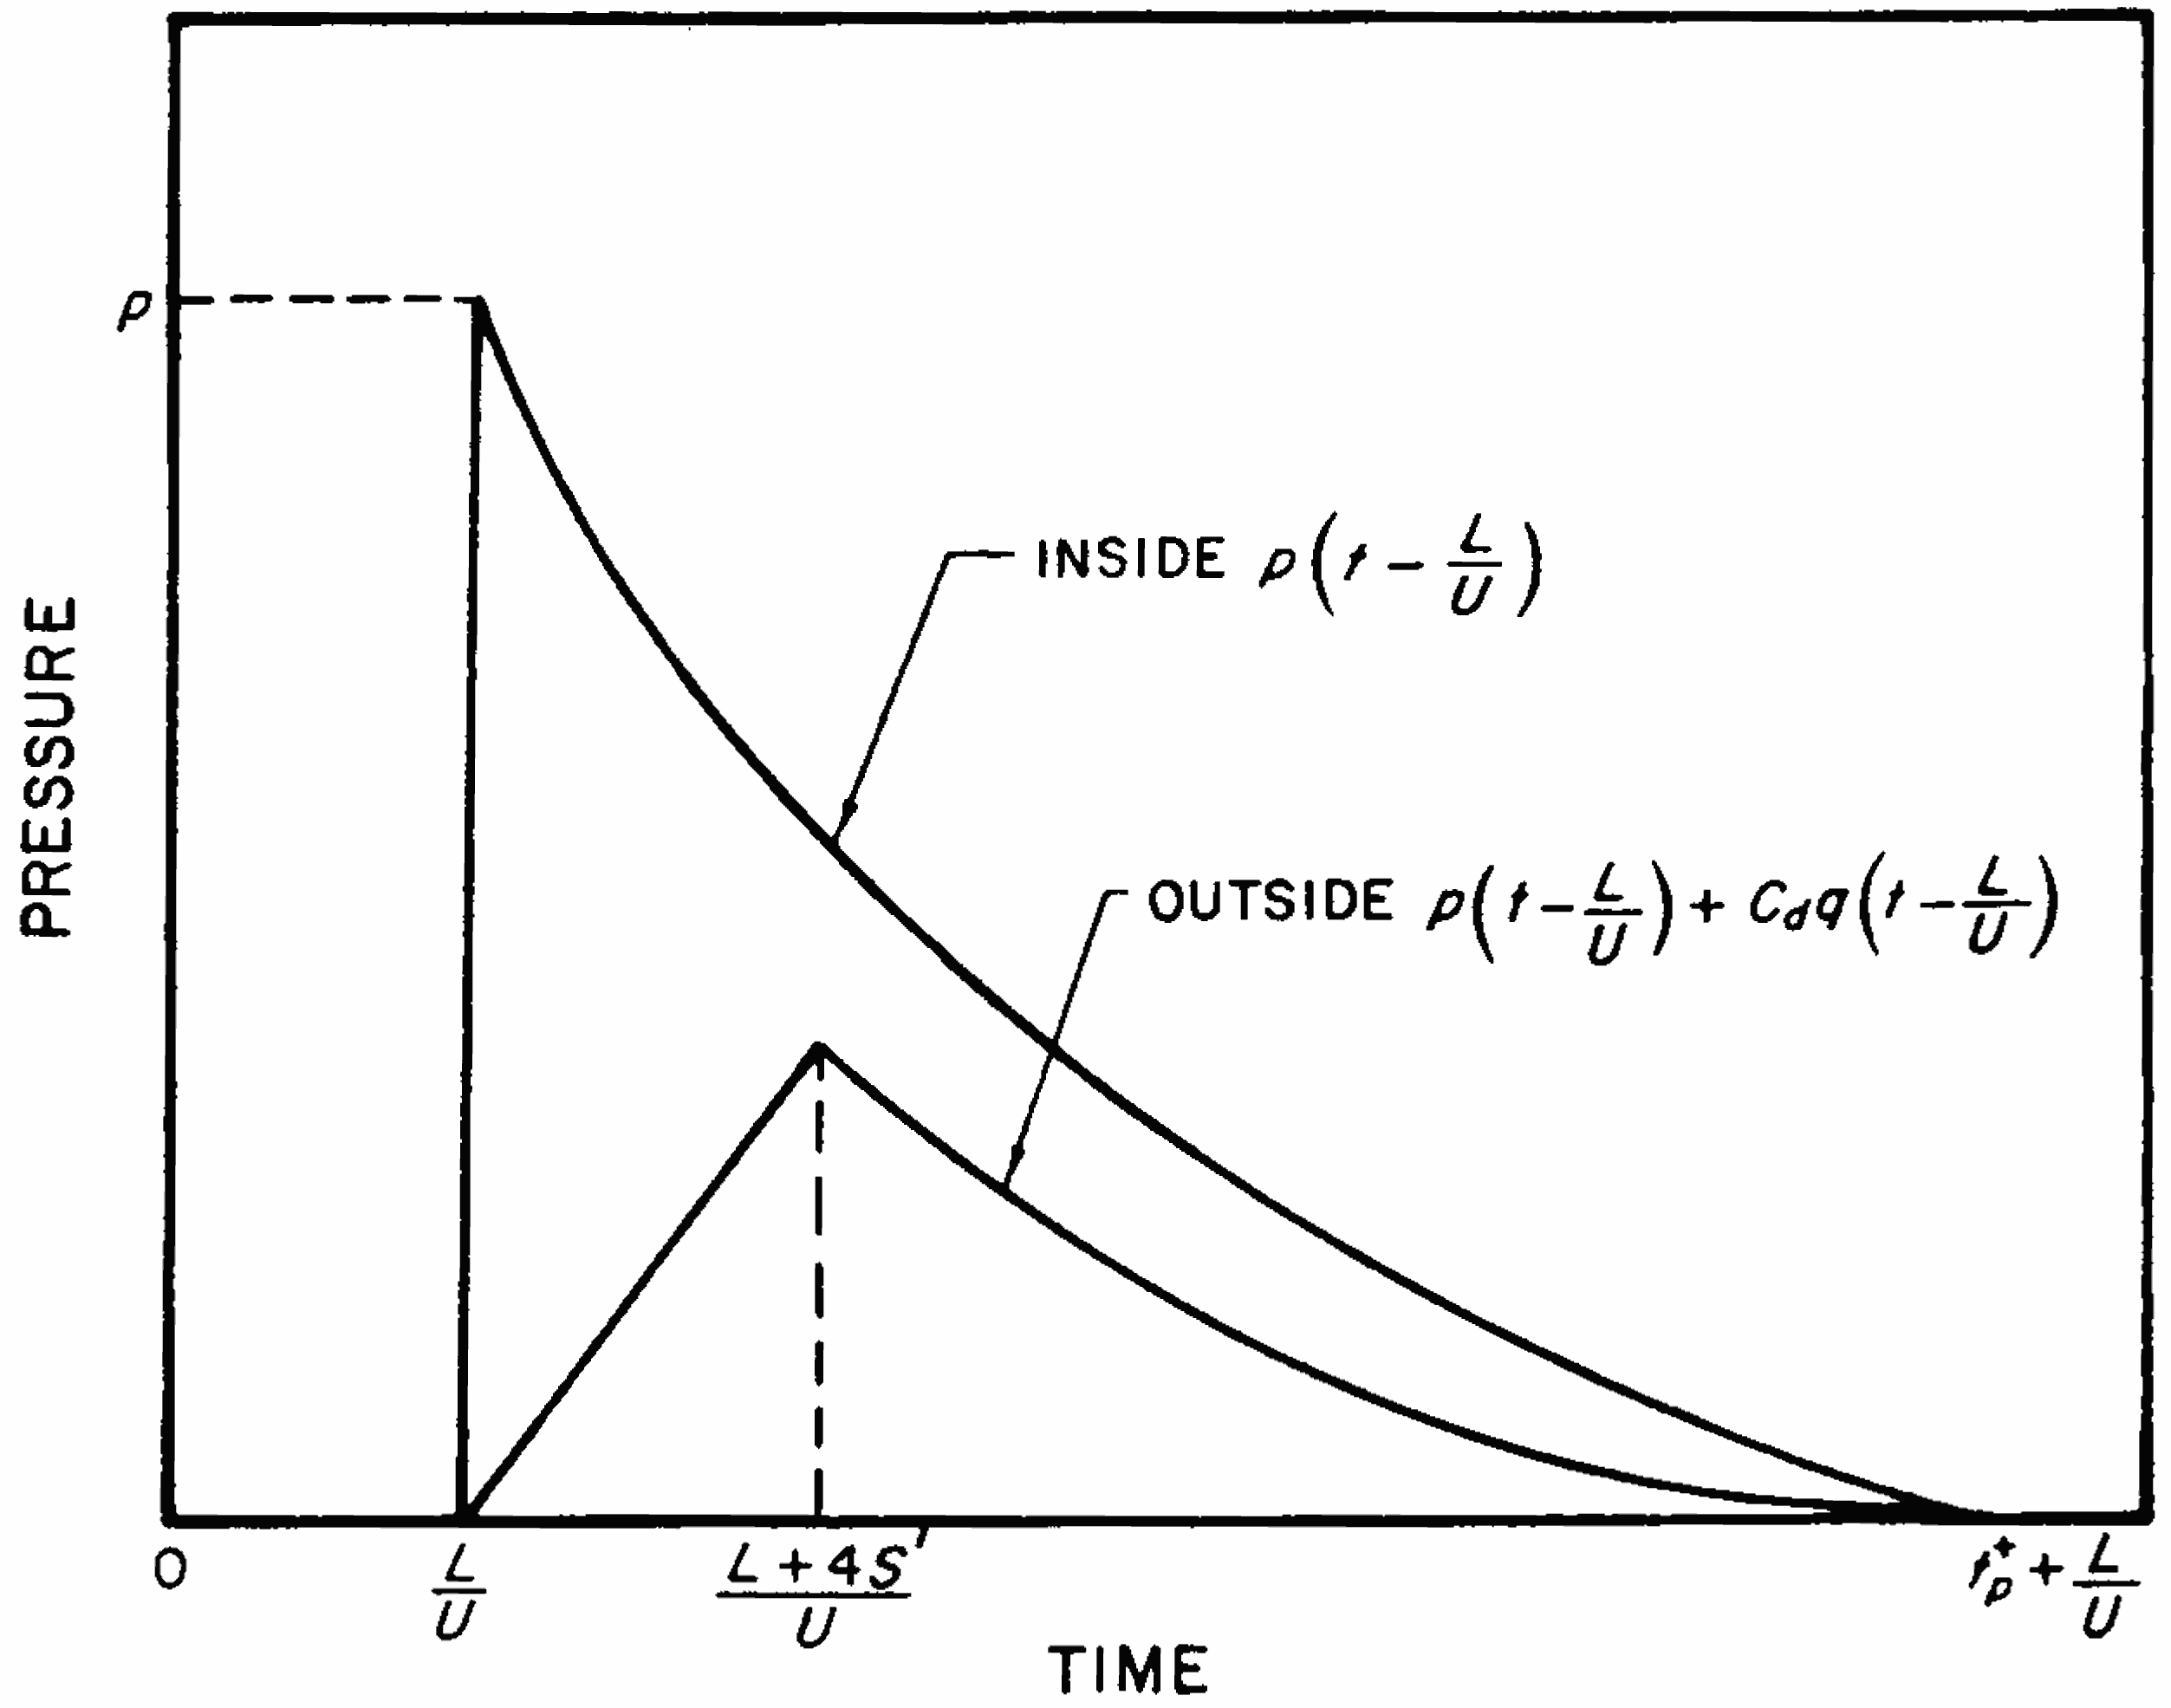
4.50 (c) Average Loading on Back Face.—The outside pressures are the same as for a closed structure, with the exception that S is replaced by S’, as described above. The inside pressure, reflected from the inside of the back face, reaches the same value as the blast overpressure at a time and then decays as ; as before, the dynamic pressure is regarded as being negligible (Fig. 4.50).
4.51 (d) Net Horizontal Loading.—The net horizontal loading is equal to the net front loading, i.e., outside minus inside, minus the net back face loading.
OPEN FRAME STRUCTURE
4.52 A structure in which small separate elements are exposed to a blast wave, e.g., a truss bridge, may be regarded as an open frame structure. Steel-frame office buildings with a majority of the wall area of glass, and industrial buildings with asbestos, light steel, or aluminum panels quickly become open frame structures after the initial impact of the blast wave.
4.53 It is difficult to determine the magnitude of the loading that the frangible wall material transmits to the frame before failing. For glass, the load transmitted is assumed to be negligible if the loading is sufficient to fracture the glass. For asbestos, transite, corrugated steel, or aluminum paneling, an approximate value of the load transmitted to the frame is an impulse of 0.04 pound-second per square inch. Depending on the span lengths and panel strength, the panels are not likely to fail when the peak overpressure is less than about 2 pounds per square inch. In this event, the full blast load is transmitted to the frame.
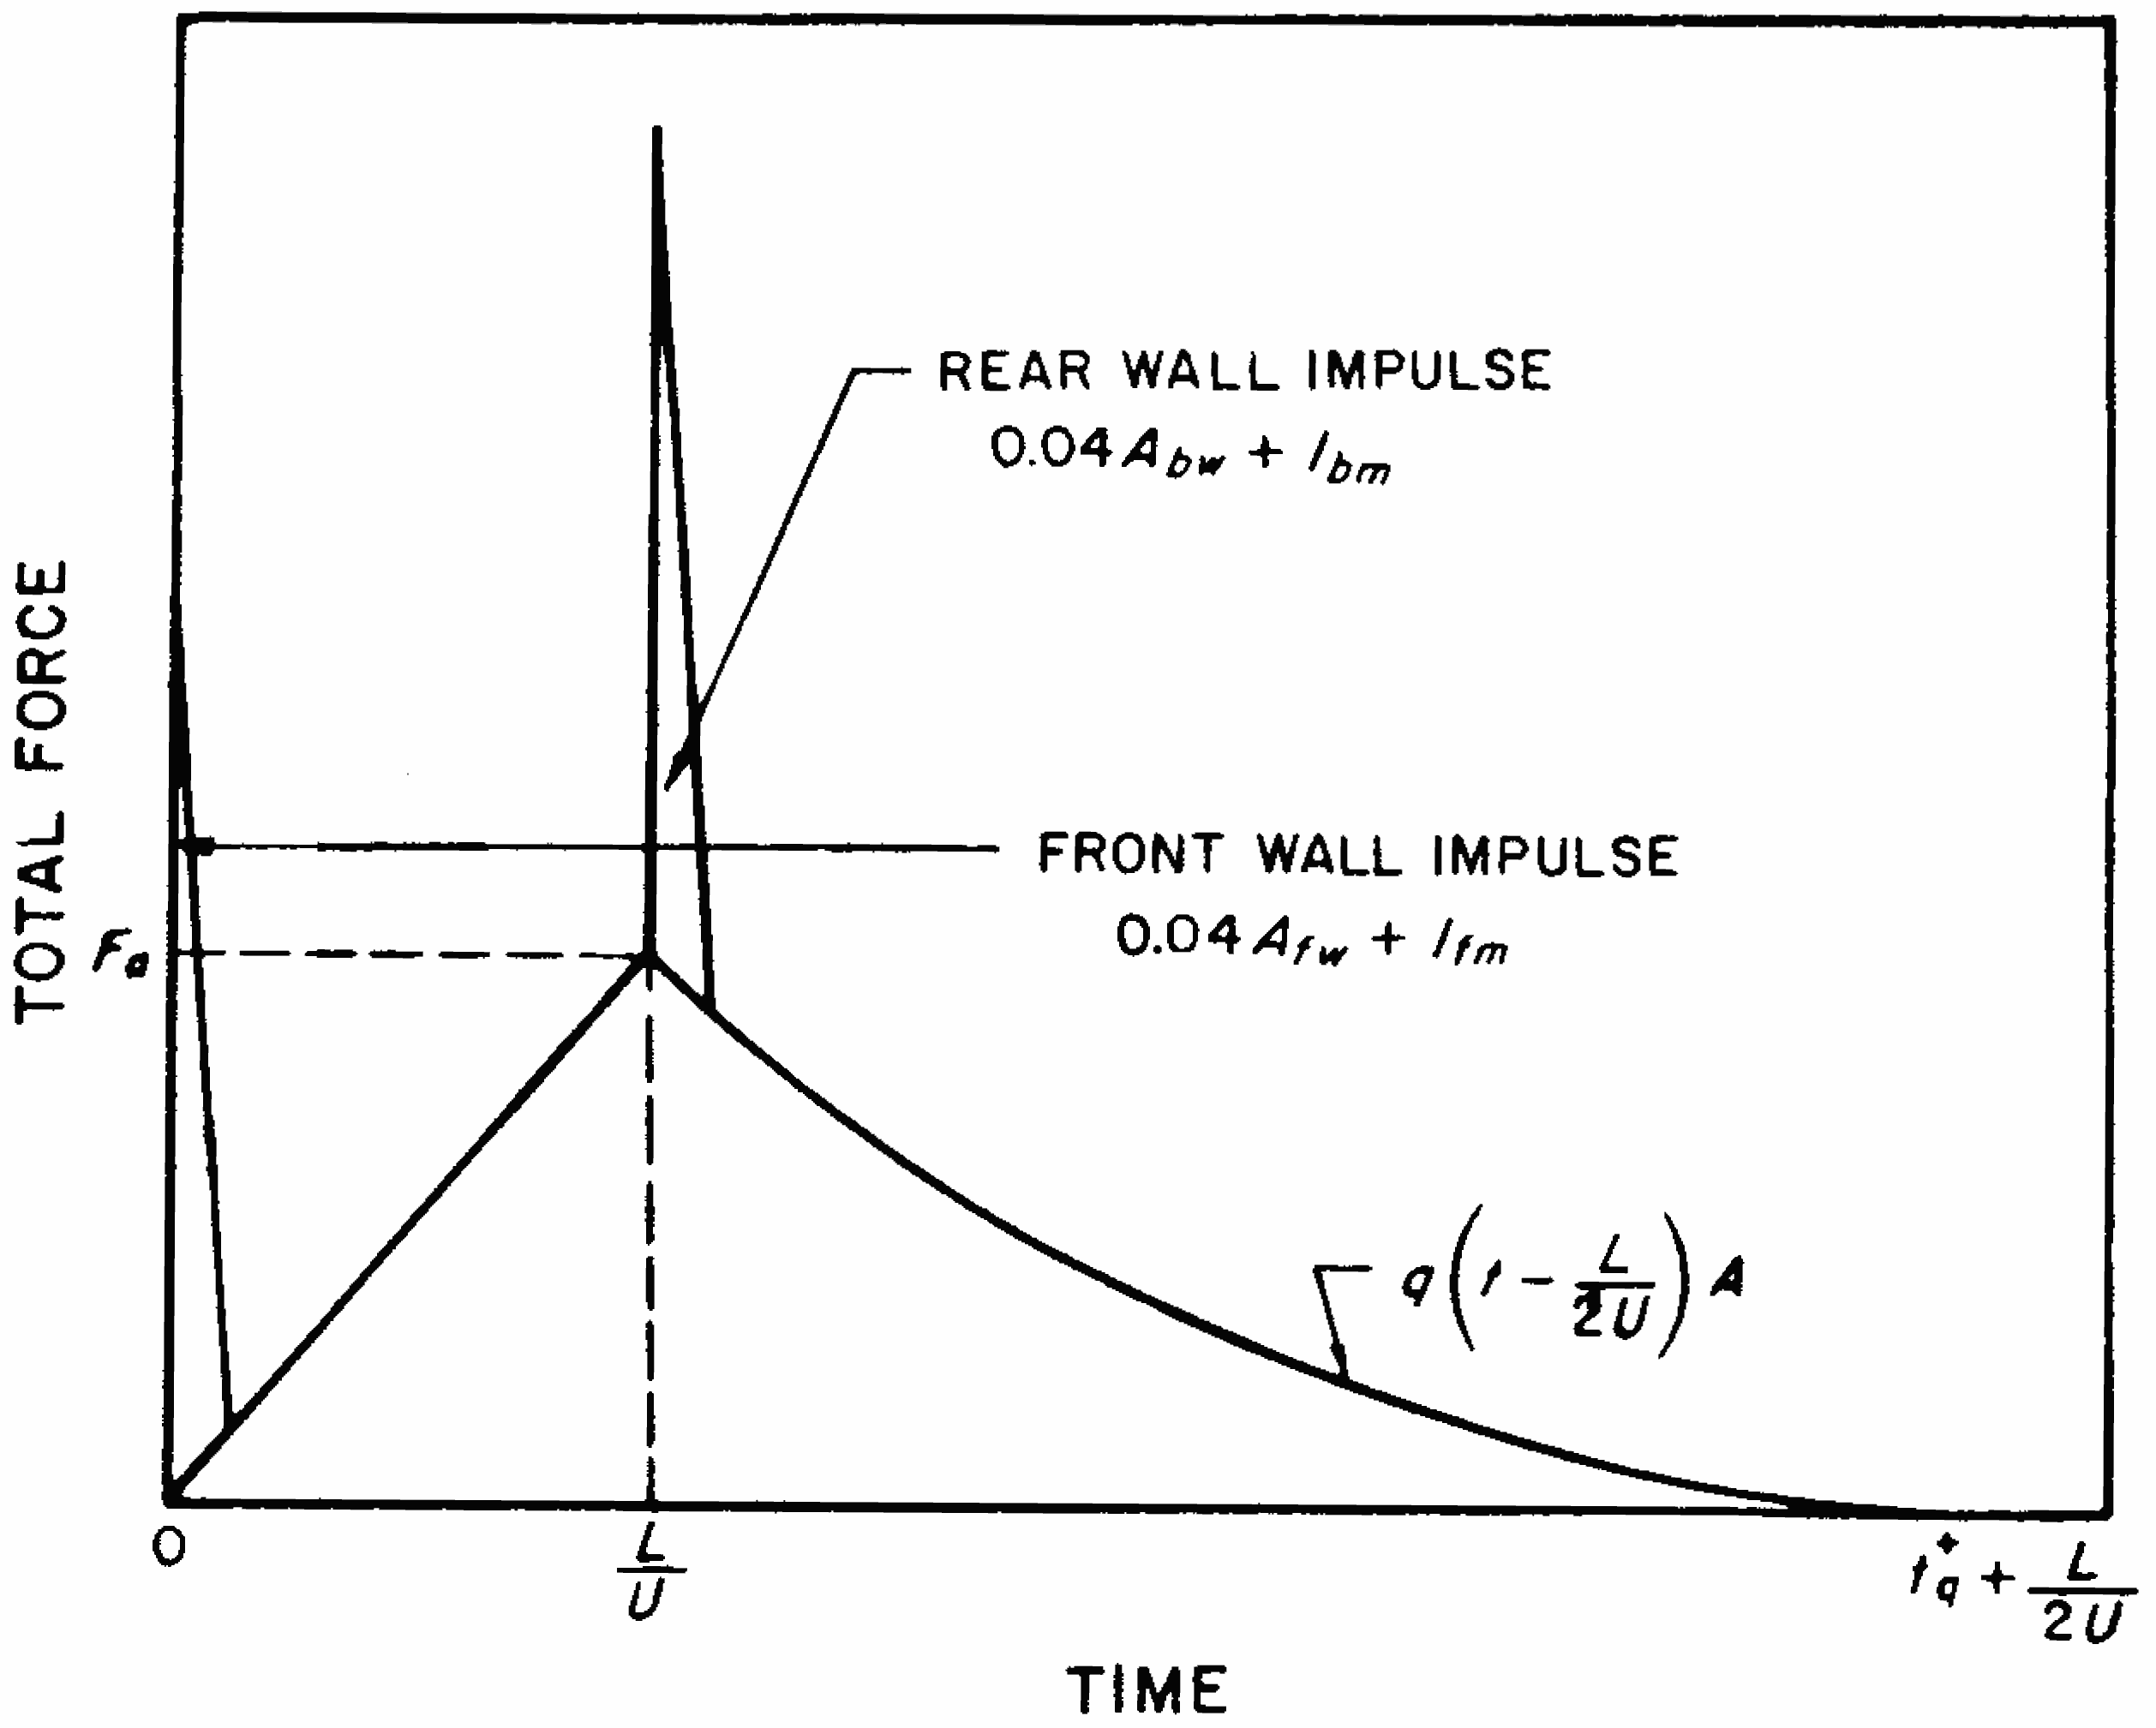
4.54 Another difficulty in the treatment of open frame structures arises in the computations of the overpressure loading on each individual member during the diffraction process. Because this process occurs at different times for various members and is affected by shielding of one member by adjacent members, the problem must be simplified. A recommended simplification is to treat the loading as an impulse, the value of which is obtained in the following manner. The overpressure loading impulse is determined for an average member treated as a closed structure and this is multiplied by the number of members. The resulting impulse is considered as being delivered at the time the shock front first strikes the structure, or it can be separated into two impulses for front and back faces where the majority of the elements are located, as shown below in Fig. 4.56.
4.55 The major portion of the loading on an open frame structure consists of the drag loading. For an individual member in the open, the drag coefficient for I-beams, channels, angles, and for members with rectangular cross section is approximately 1.5. However, because in a frame the various members shield one another to some extent from the full blast loading, the average drag coefficient when the whole frame is considered is reduced to 1.0. The force , i.e., pressure multiplied by area, on an individual member is thus given by
where is 1.5 and is the member area projected perpendicular to the direction of blast propagation. For the loading on the frame, however, the force is
where Cd is 1.0 and IA; is the sum of the projected areas of all the members. The result may thus be written in the form
where .
4.56 The loading (force) versus time for a frame of length , having major areas in the planes of the front and rear faces, is shown in Fig. 4.56. The symbols , and , represent the areas of the front and back faces, respectively, which transmit loads before failure, and and are the overpressure loading impulses on front and back members, respectively. Although drag loading commences immediately after the blast wave strikes the front face, i.e., at , the back face is not fully loaded until the wave has traveled the distance , i.e., at time . The average drag loading, , on the entire structure at this time is considered to be that which would occur at the distance from the front of the structure, so that
and the average force on the frame, (frame), is
where is 1.0, as above. After this time, the average drag force on the frame at any time is given by
where lies between and , as seen in Fig. 4.56.
CYLINDRICAL STRUCTURE
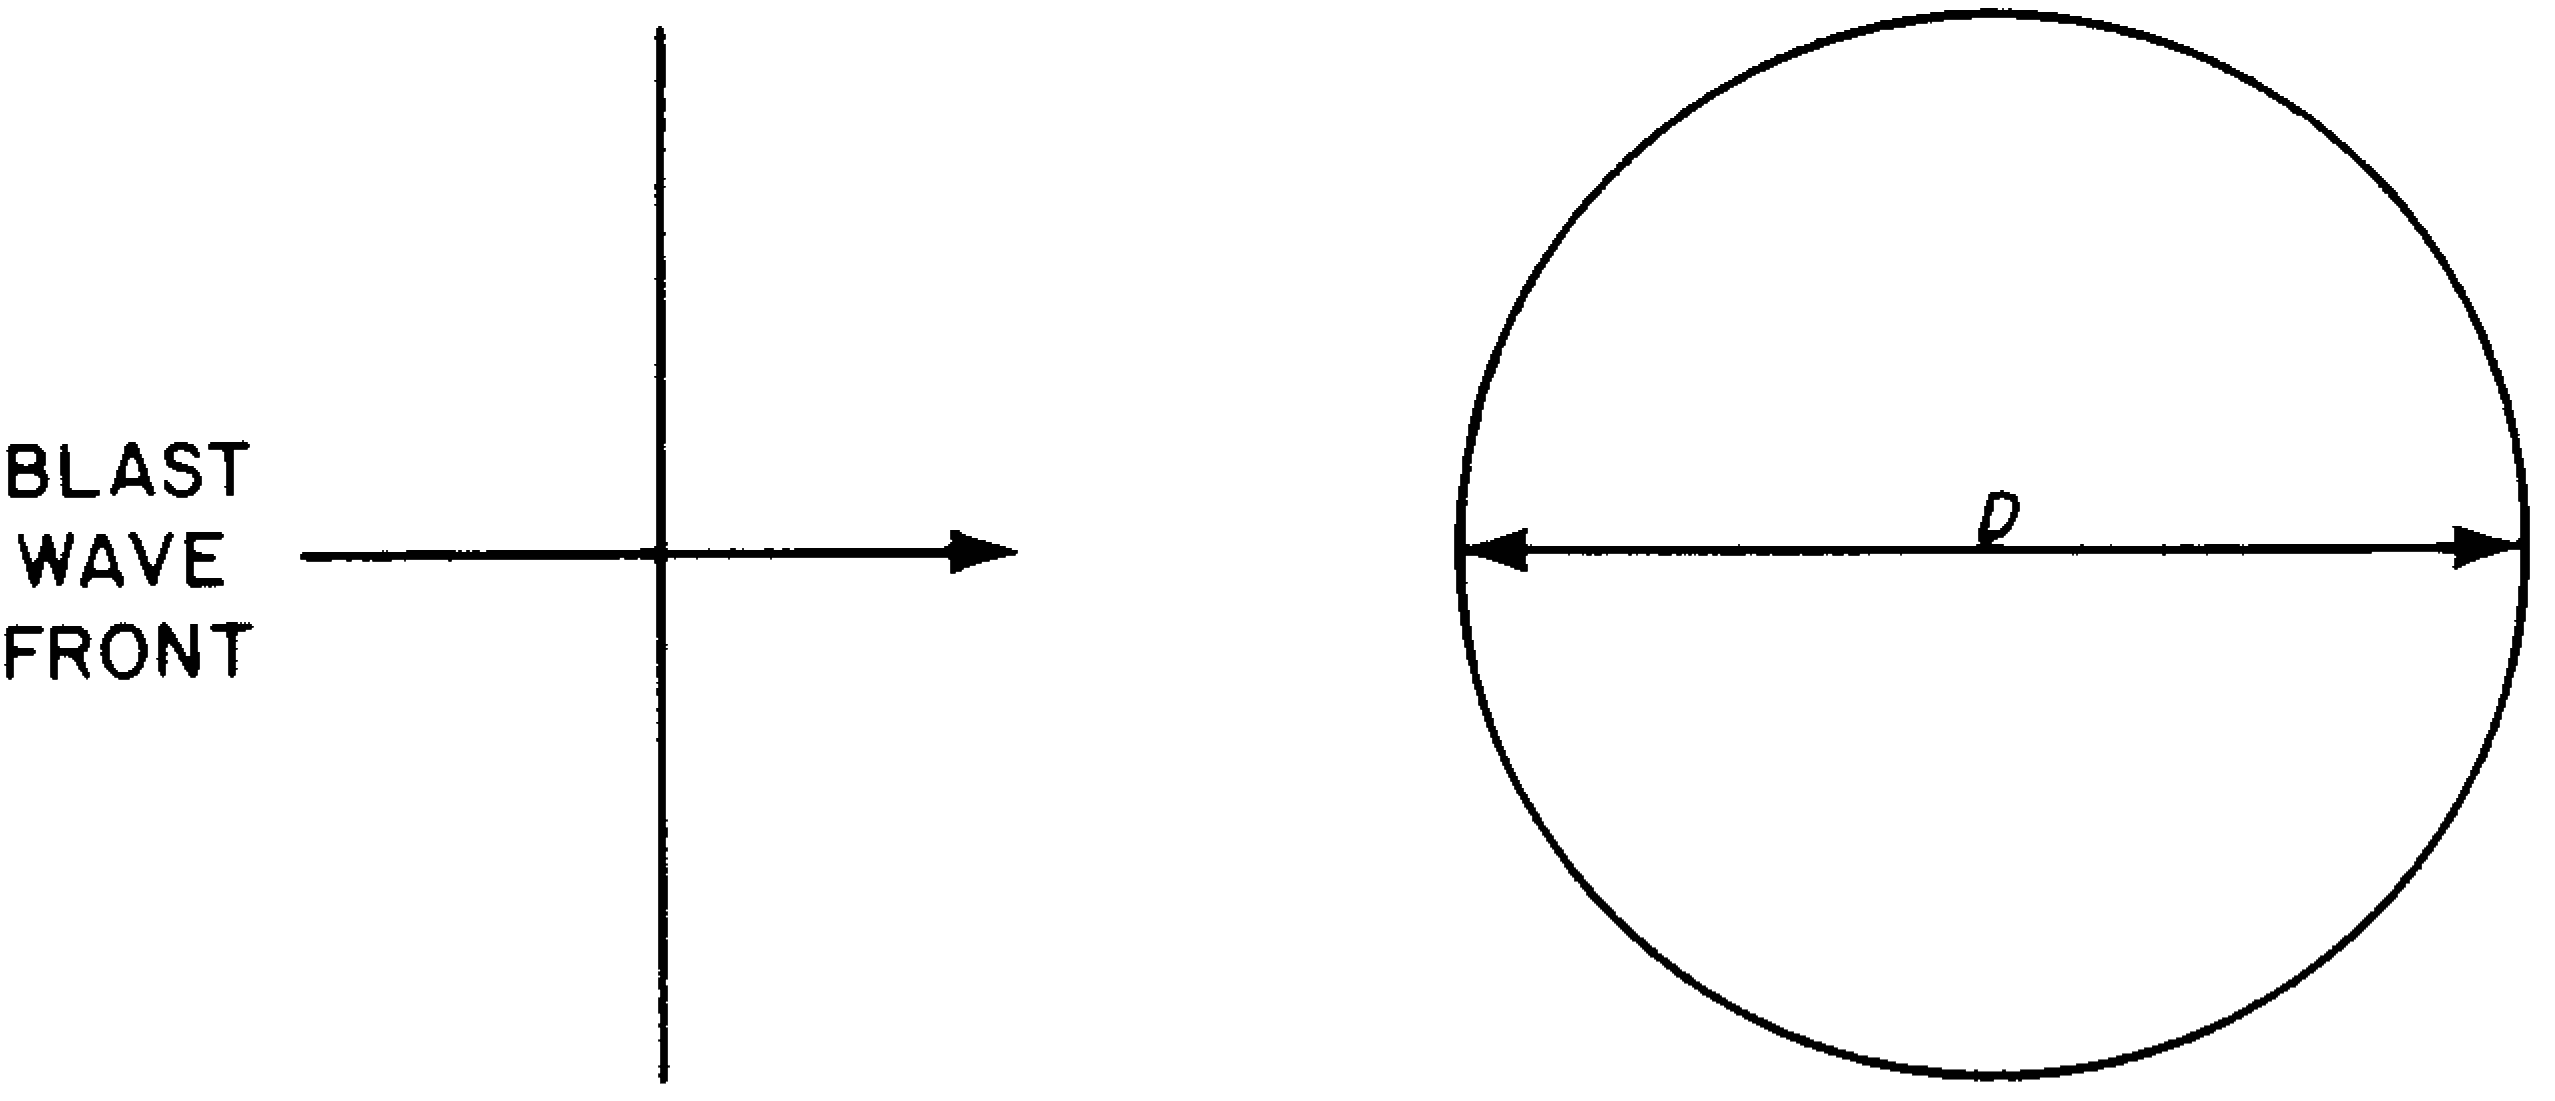
4.57 The following treatment is applicable to structures with a circular cross section, such as telephone poles and smokestacks, for which the diameters are small compared to the lengths. The discussion presented here provides methods for determining average pressures on projected areas of cylindrical structures with the direction of propagation of the blast perpendicular to the axis of the cylinder. A more detailed method for determining the pressure time curves for points on cylinders is provided in the discussion of the loading on arched structures in § 4.62 et seq. The general situation for a blast wave approaching a cylindrical structure is represented in section in Fig. 4.57.
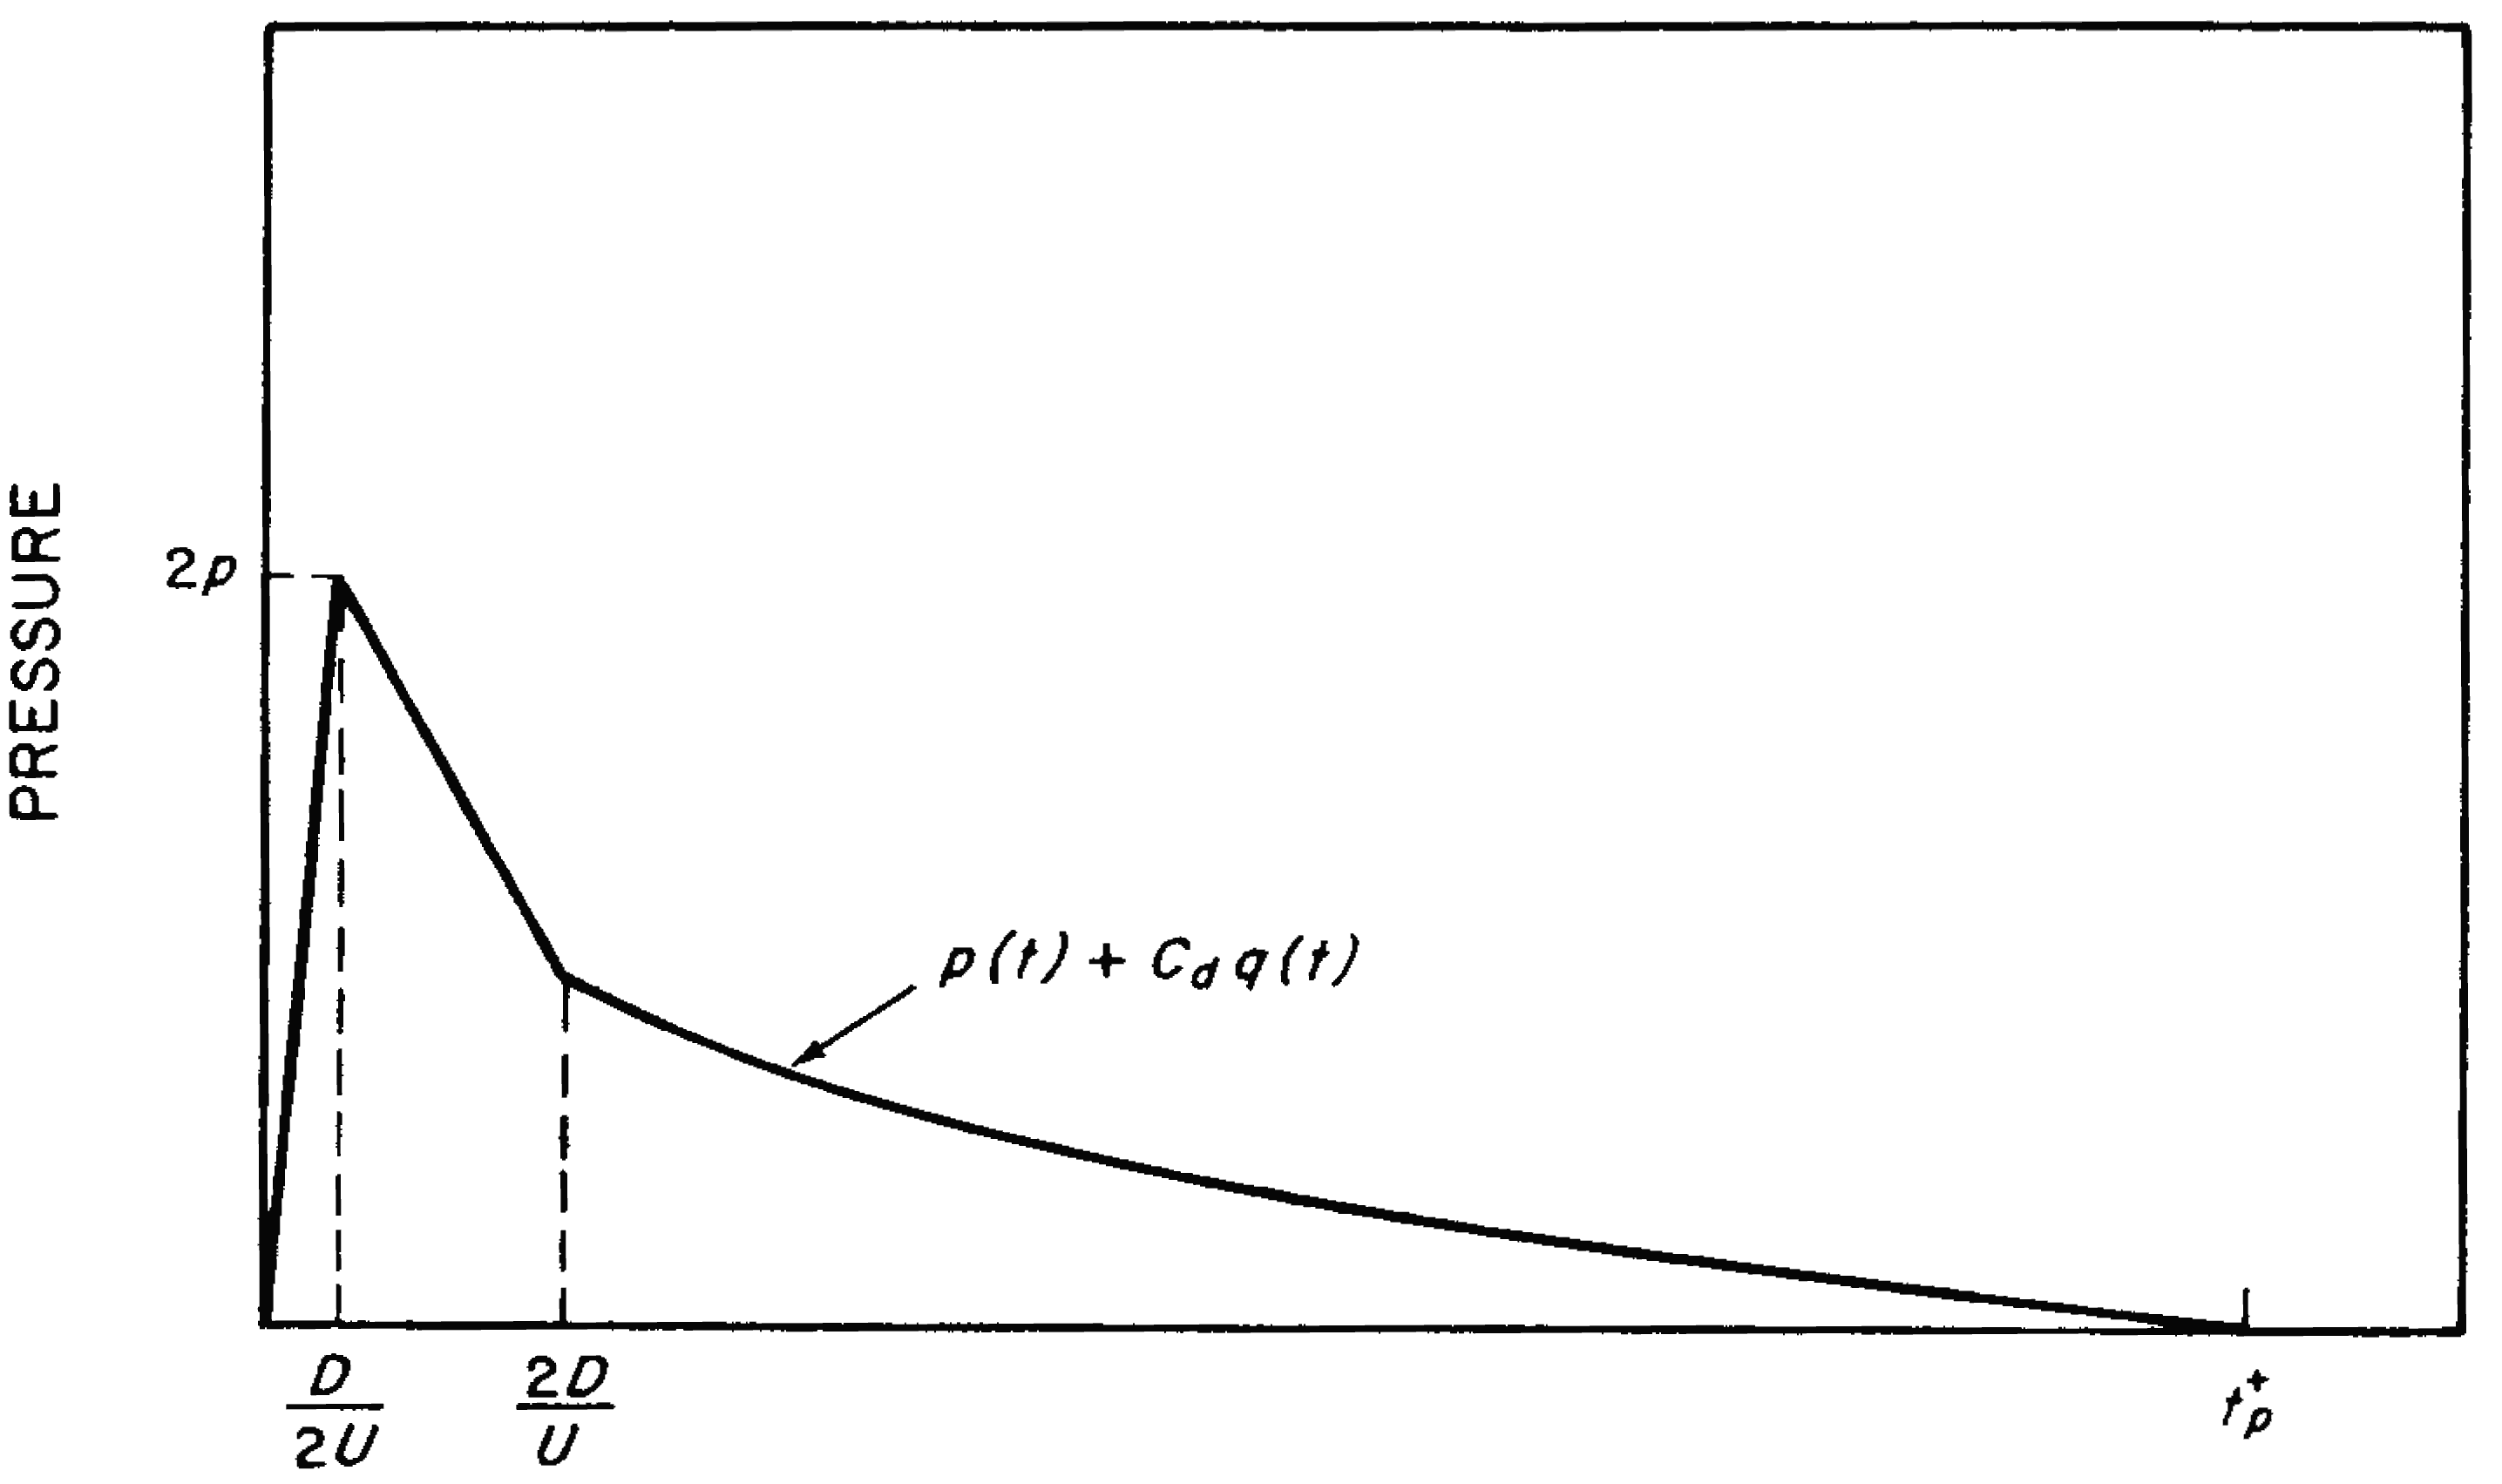
4.58 (a) Average Loading on Front Surface.—When an ideal blast wave impinges on a flat surface of a structure, the pressure rises instantaneously to the reflected value and then it soon drops to the stagnation pressure (§ 4.25). On the curved surface of a cylinder the interaction of the blast wave with the front face is much more complex in detail. However, in terms of the average pressure, the load appears as a force that increases with time from zero when the blast front arrives to a maximum when the blast wave has propagated one radius. This occurs at a time , where is the diameter of the cylinder. For the blast pressure range being considered, the maximum average pressure reaches a value of about as depicted in Fig. 4.58. The load on the front-surface then decays in an approximately linear manner to the value it would have at about time . Subsequently, the average pressure decreases as shown. The drag coefficient for the front surface of the cylinder is 0.8.
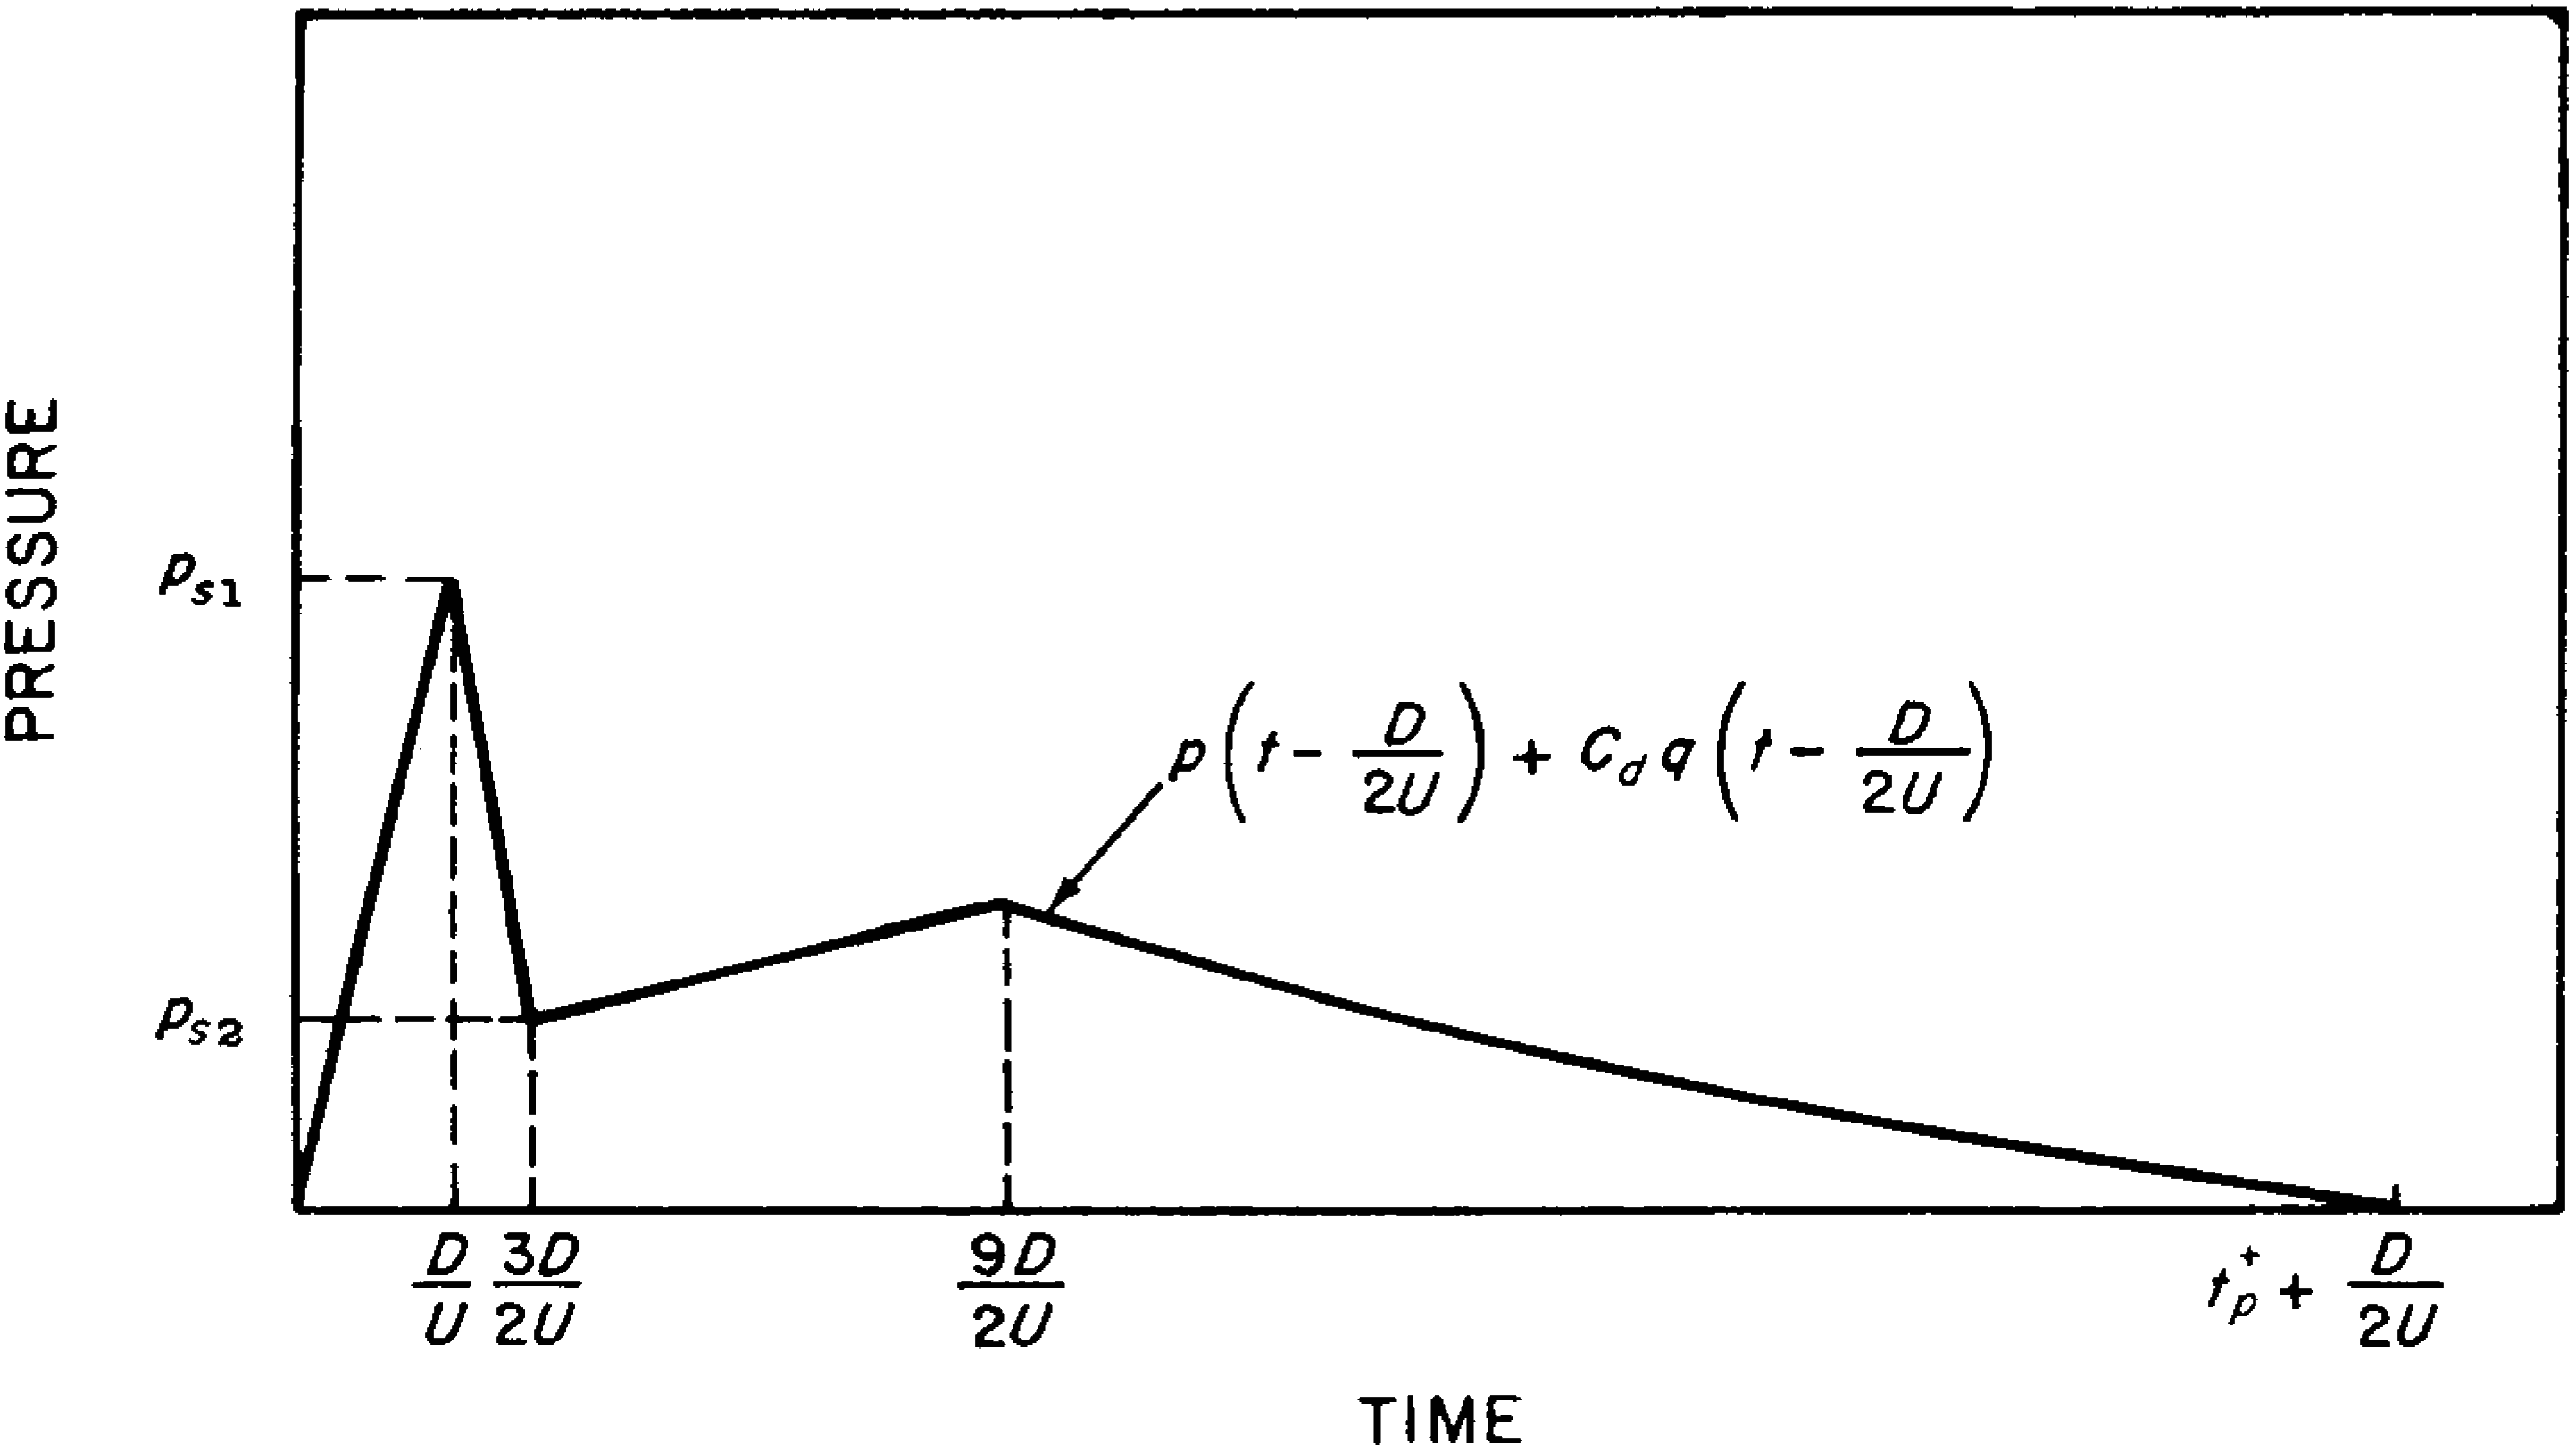
4.59 (b) Average Loading on the Sides.—Loading of the sides commences immediately after the blast wave strikes the front surface but, as with the closed box discussed in § 4.41 et seq., the sides are not fully loaded until the wave has traveled the distance , i.e., at time . The average pressure on the sides at this time is indicated by , given approximately by
Complex vortex formation then causes the average pressure to drop to a minimum, at the time ; the value of is about half the maximum overpressure at this time, i.e.,
The average pressure on the side then rises until time and subsequently decays as shown in Fig. 4.59. The drag coefficient for the side face is 0.9.
4.60 (c) Average Loading on Back Surface.—The blast wave begins to affect the back surface of the cylinder at time and the average pressure gradually builds up to (Fig. 4.60) at a time of about . The value of is given by
The average pressure continues to rise until it reaches a maximum, at a time of about , where
The average pressure at any time after the maximum is represented by
where lies between and . The drag coefficient for the back surface is -0.2.
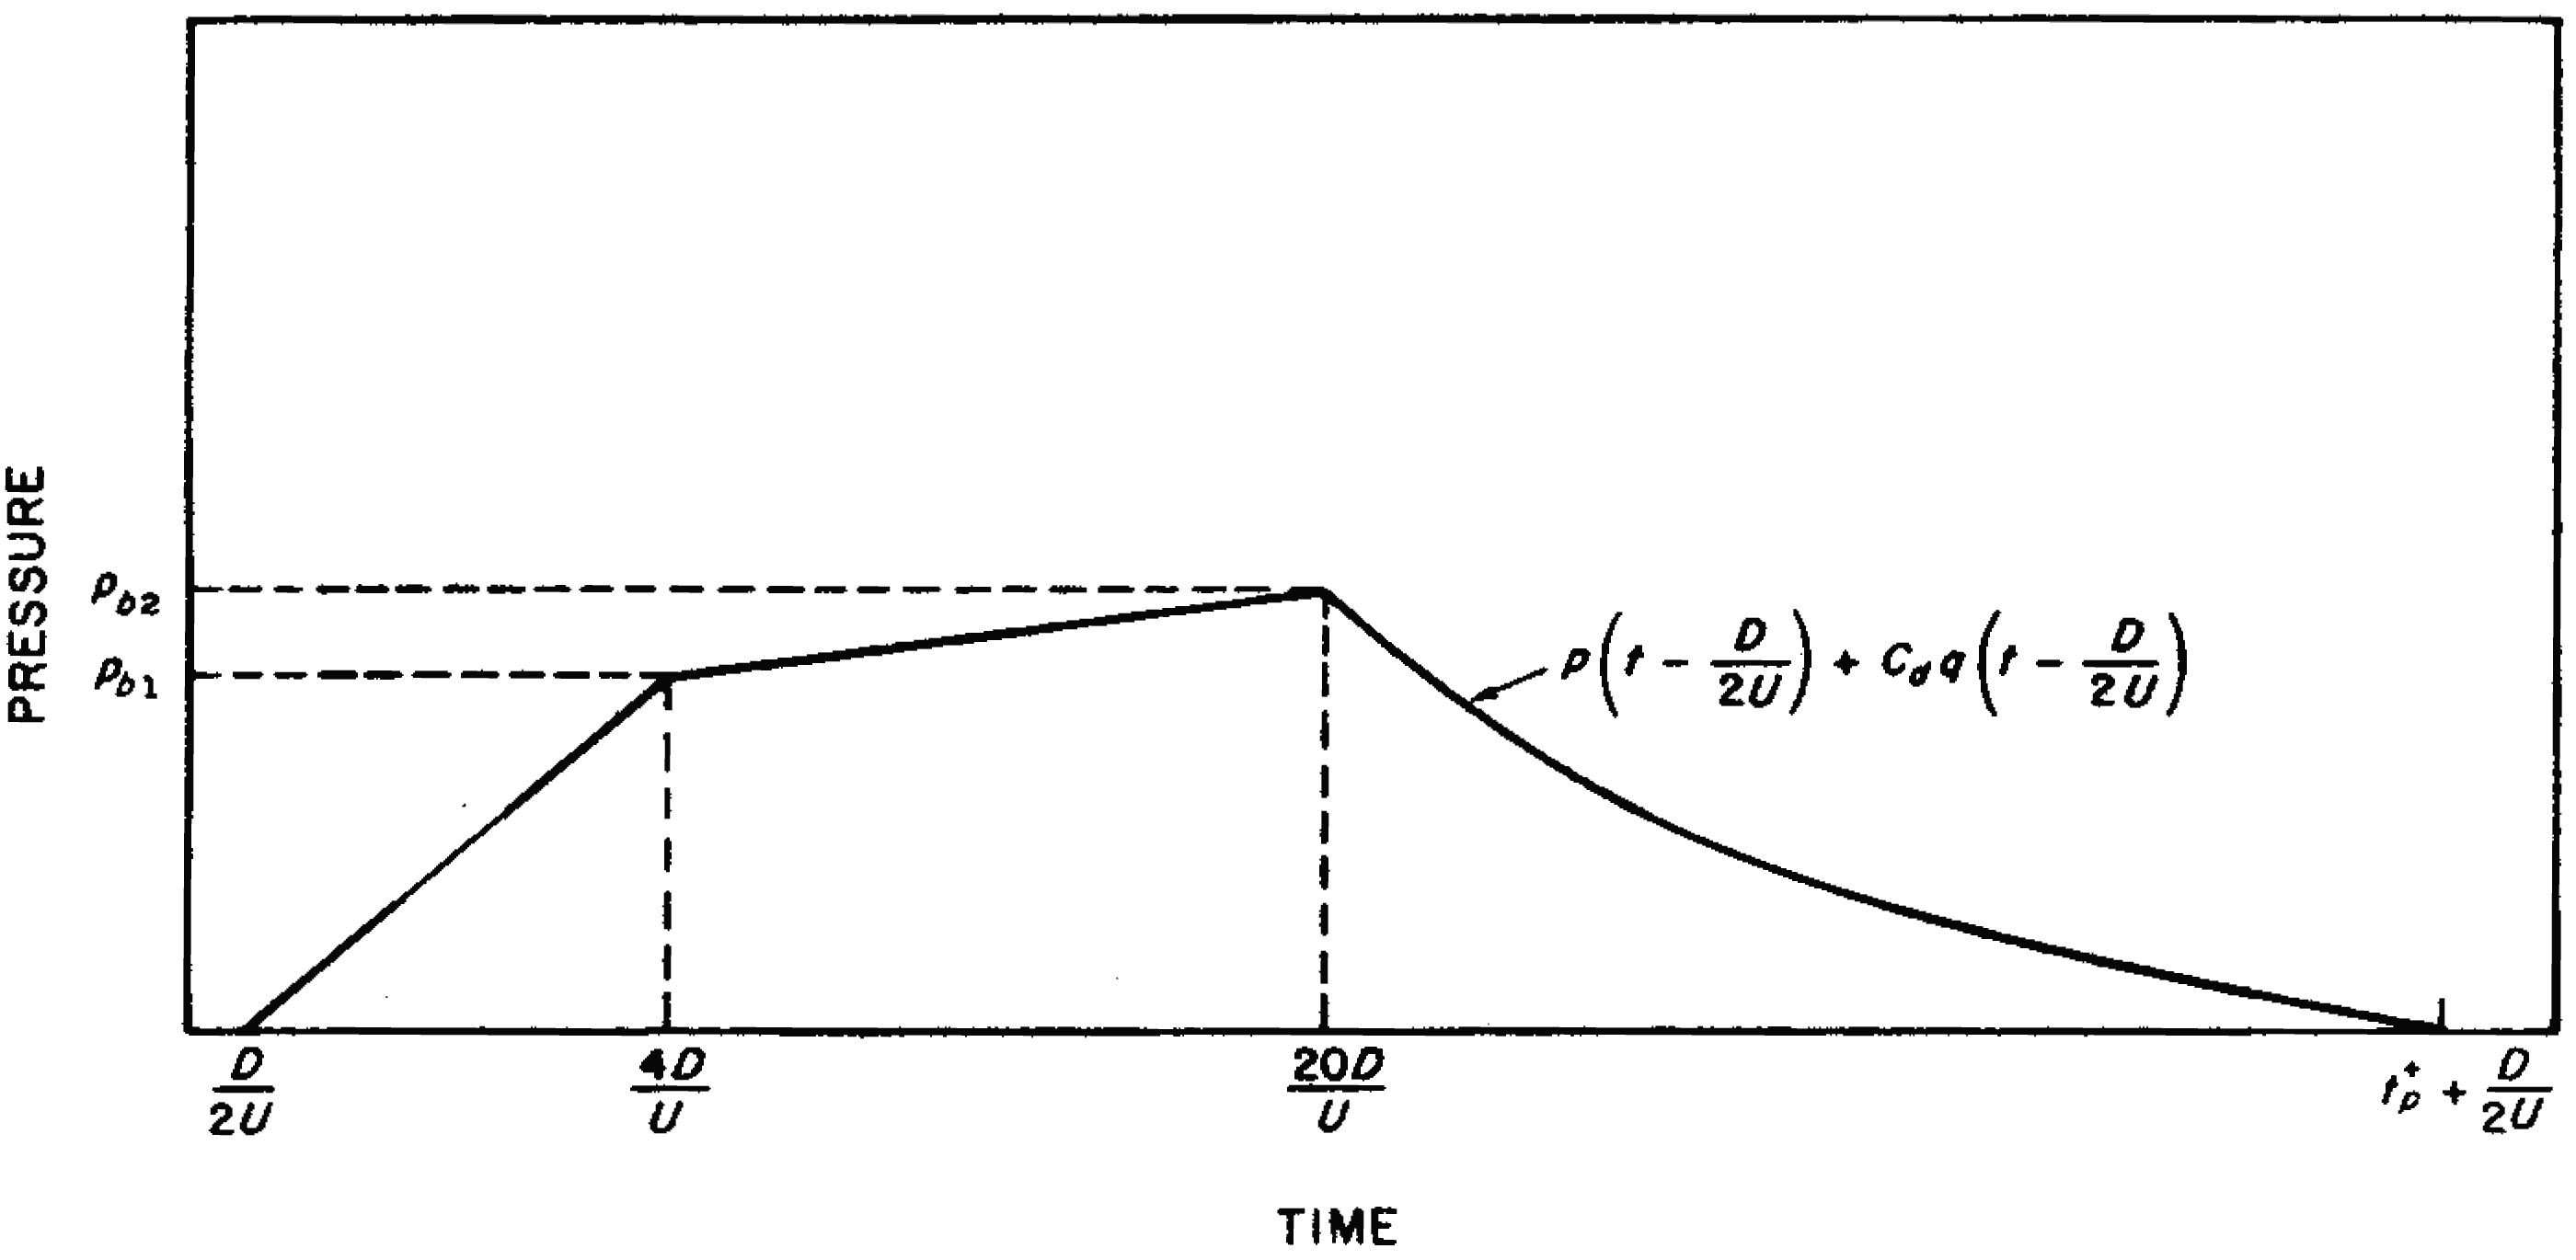
4.61 The preceding discussion has been concerned with average values of the loads on the various surfaces of a cylinder, whereas the actual pressures vary continuously from point to point. Consequently, the net horizontal loading cannot be determined accurately by the simple process of subtracting the back loading from the front loading. A rough approximation of the net load may be obtained by procedures similar to those described for a closed box-like structure (§ 4.45), but a better approximation is given by the method referred to in § 4.65 et seq.
ARCHED STRUCTURES
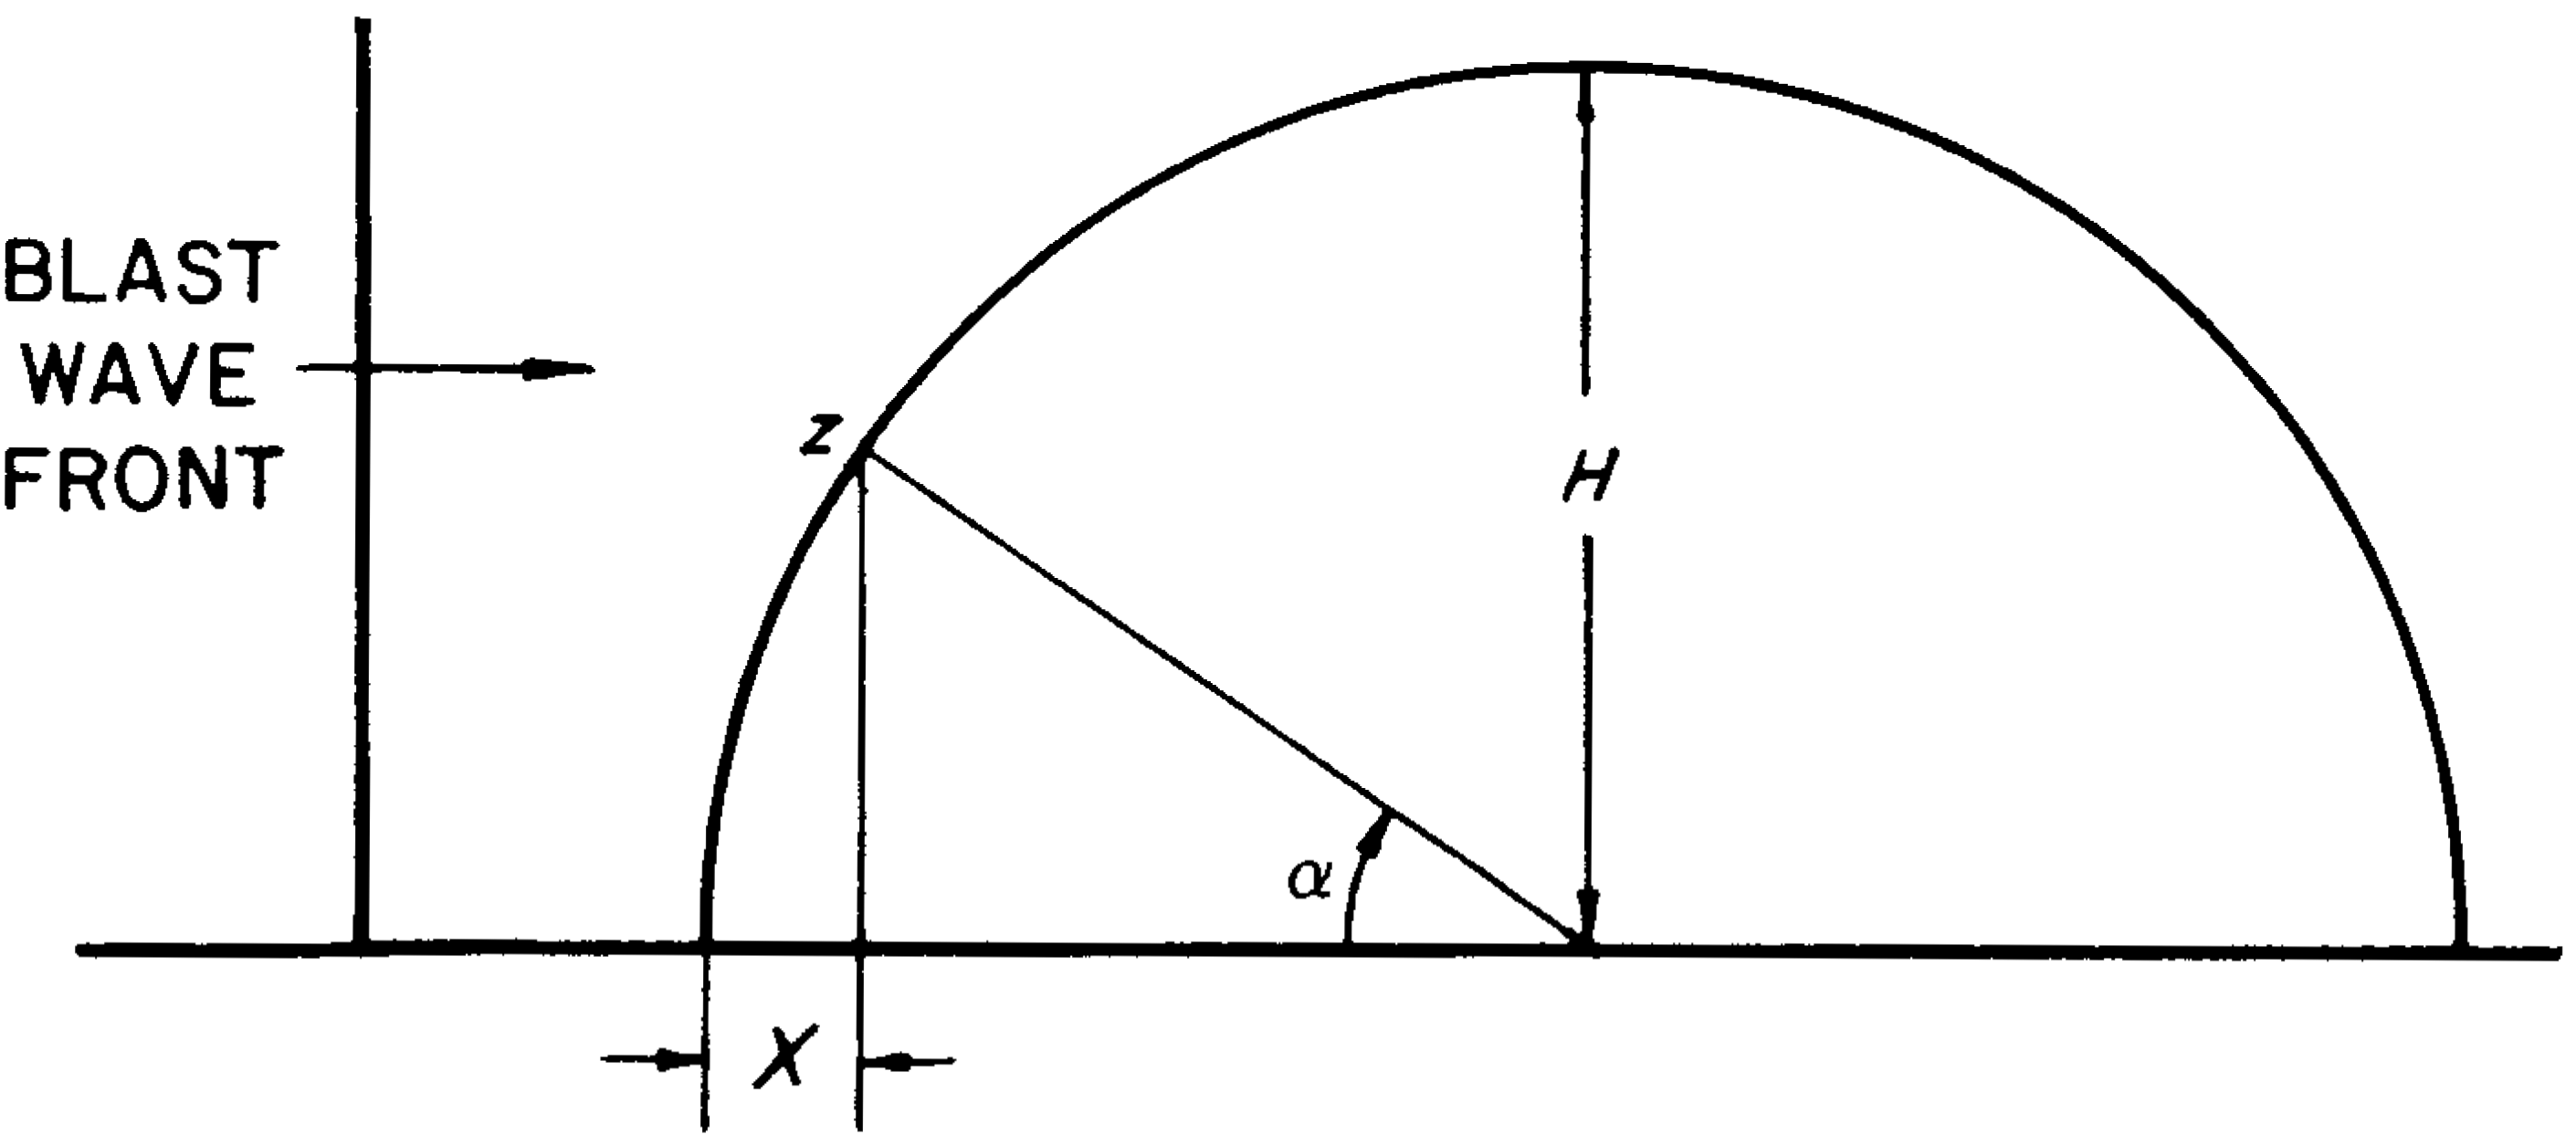
4.62 The following treatment is applicable to arched structures, such as ground huts, and, as a rough approximation, to dome shaped or spherical structures. The discussion presented here is for a semicylindrical structure with the direction of propagation of the blast perpendicular to the axis of the cylinder. The results can be applied to a cylindrical structure, such as discussed above, since it consists of two such semicylinders with identical loadings on each half. Whereas the preceding treatment referred to the average loads on the various faces of the cylinder (§ 4.57 et seq.), the present discussion describes the loads at each point. The general situation is depicted in Fig. 4.62; is the height of the arch (or the radius of the cylinder) and represents any point on the surface. The angle between the horizontal (or springing line) and the line joining to the center of curvature of the semicircle is indicated by ; and , equal to , is the horizontal distance, in the direction of propagation of the blast wave, between the bottom of the arch and the arbitrary point .
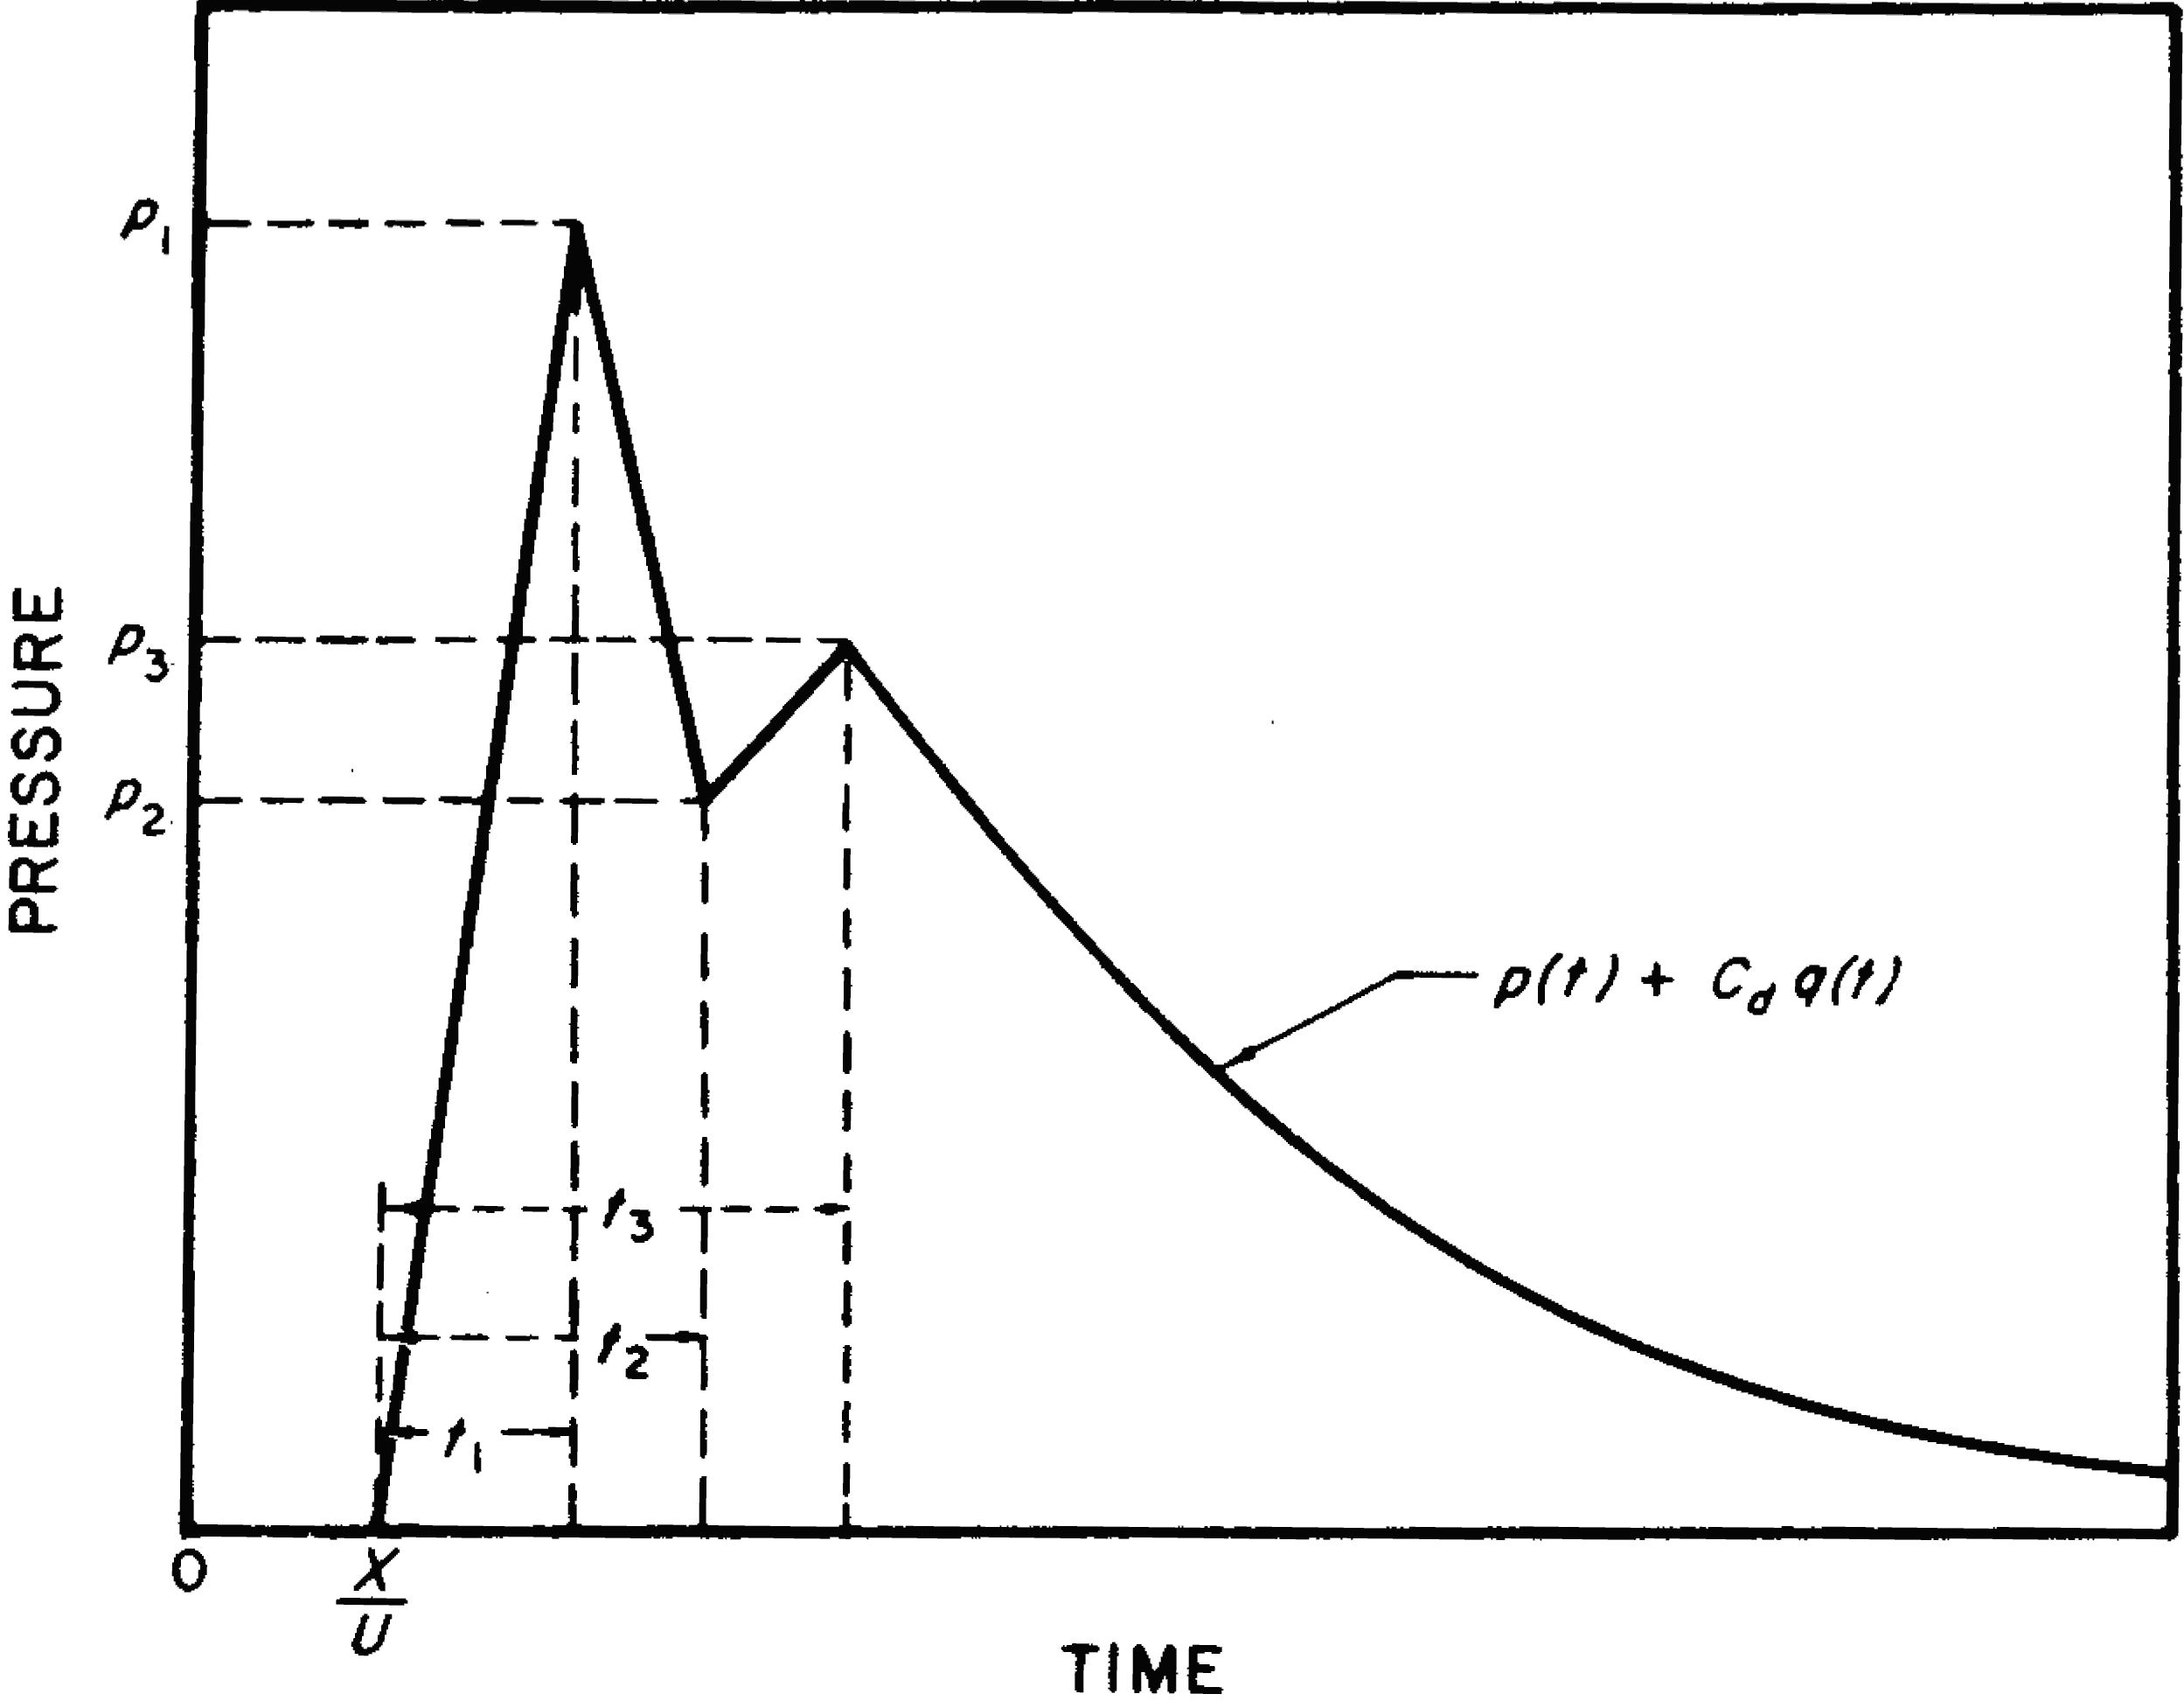
4.63 When an ideal blast wave impinges on a curved surface, vortex formation occurs just after reflection, so that there may be a temporary sharp pressure drop before the stagnation pressure is reached. A generalized representation of the variation of the pressure with time at any point, , is shown in Fig. 4.63. The blast wave front strikes the base of the arch at time and the time of arrival at the point , regardless of whether it is on the front or back half, is . The overpressure then rises sharply, in the time interval , to the reflected value, , so that is the rise time. Vortex formation causes the pressure to drop to , and this is followed by an increase to , the stagnation pressure; subsequently, the pressure, which is equal to , where is the appropriate drag coefficient, decays in the normal manner.
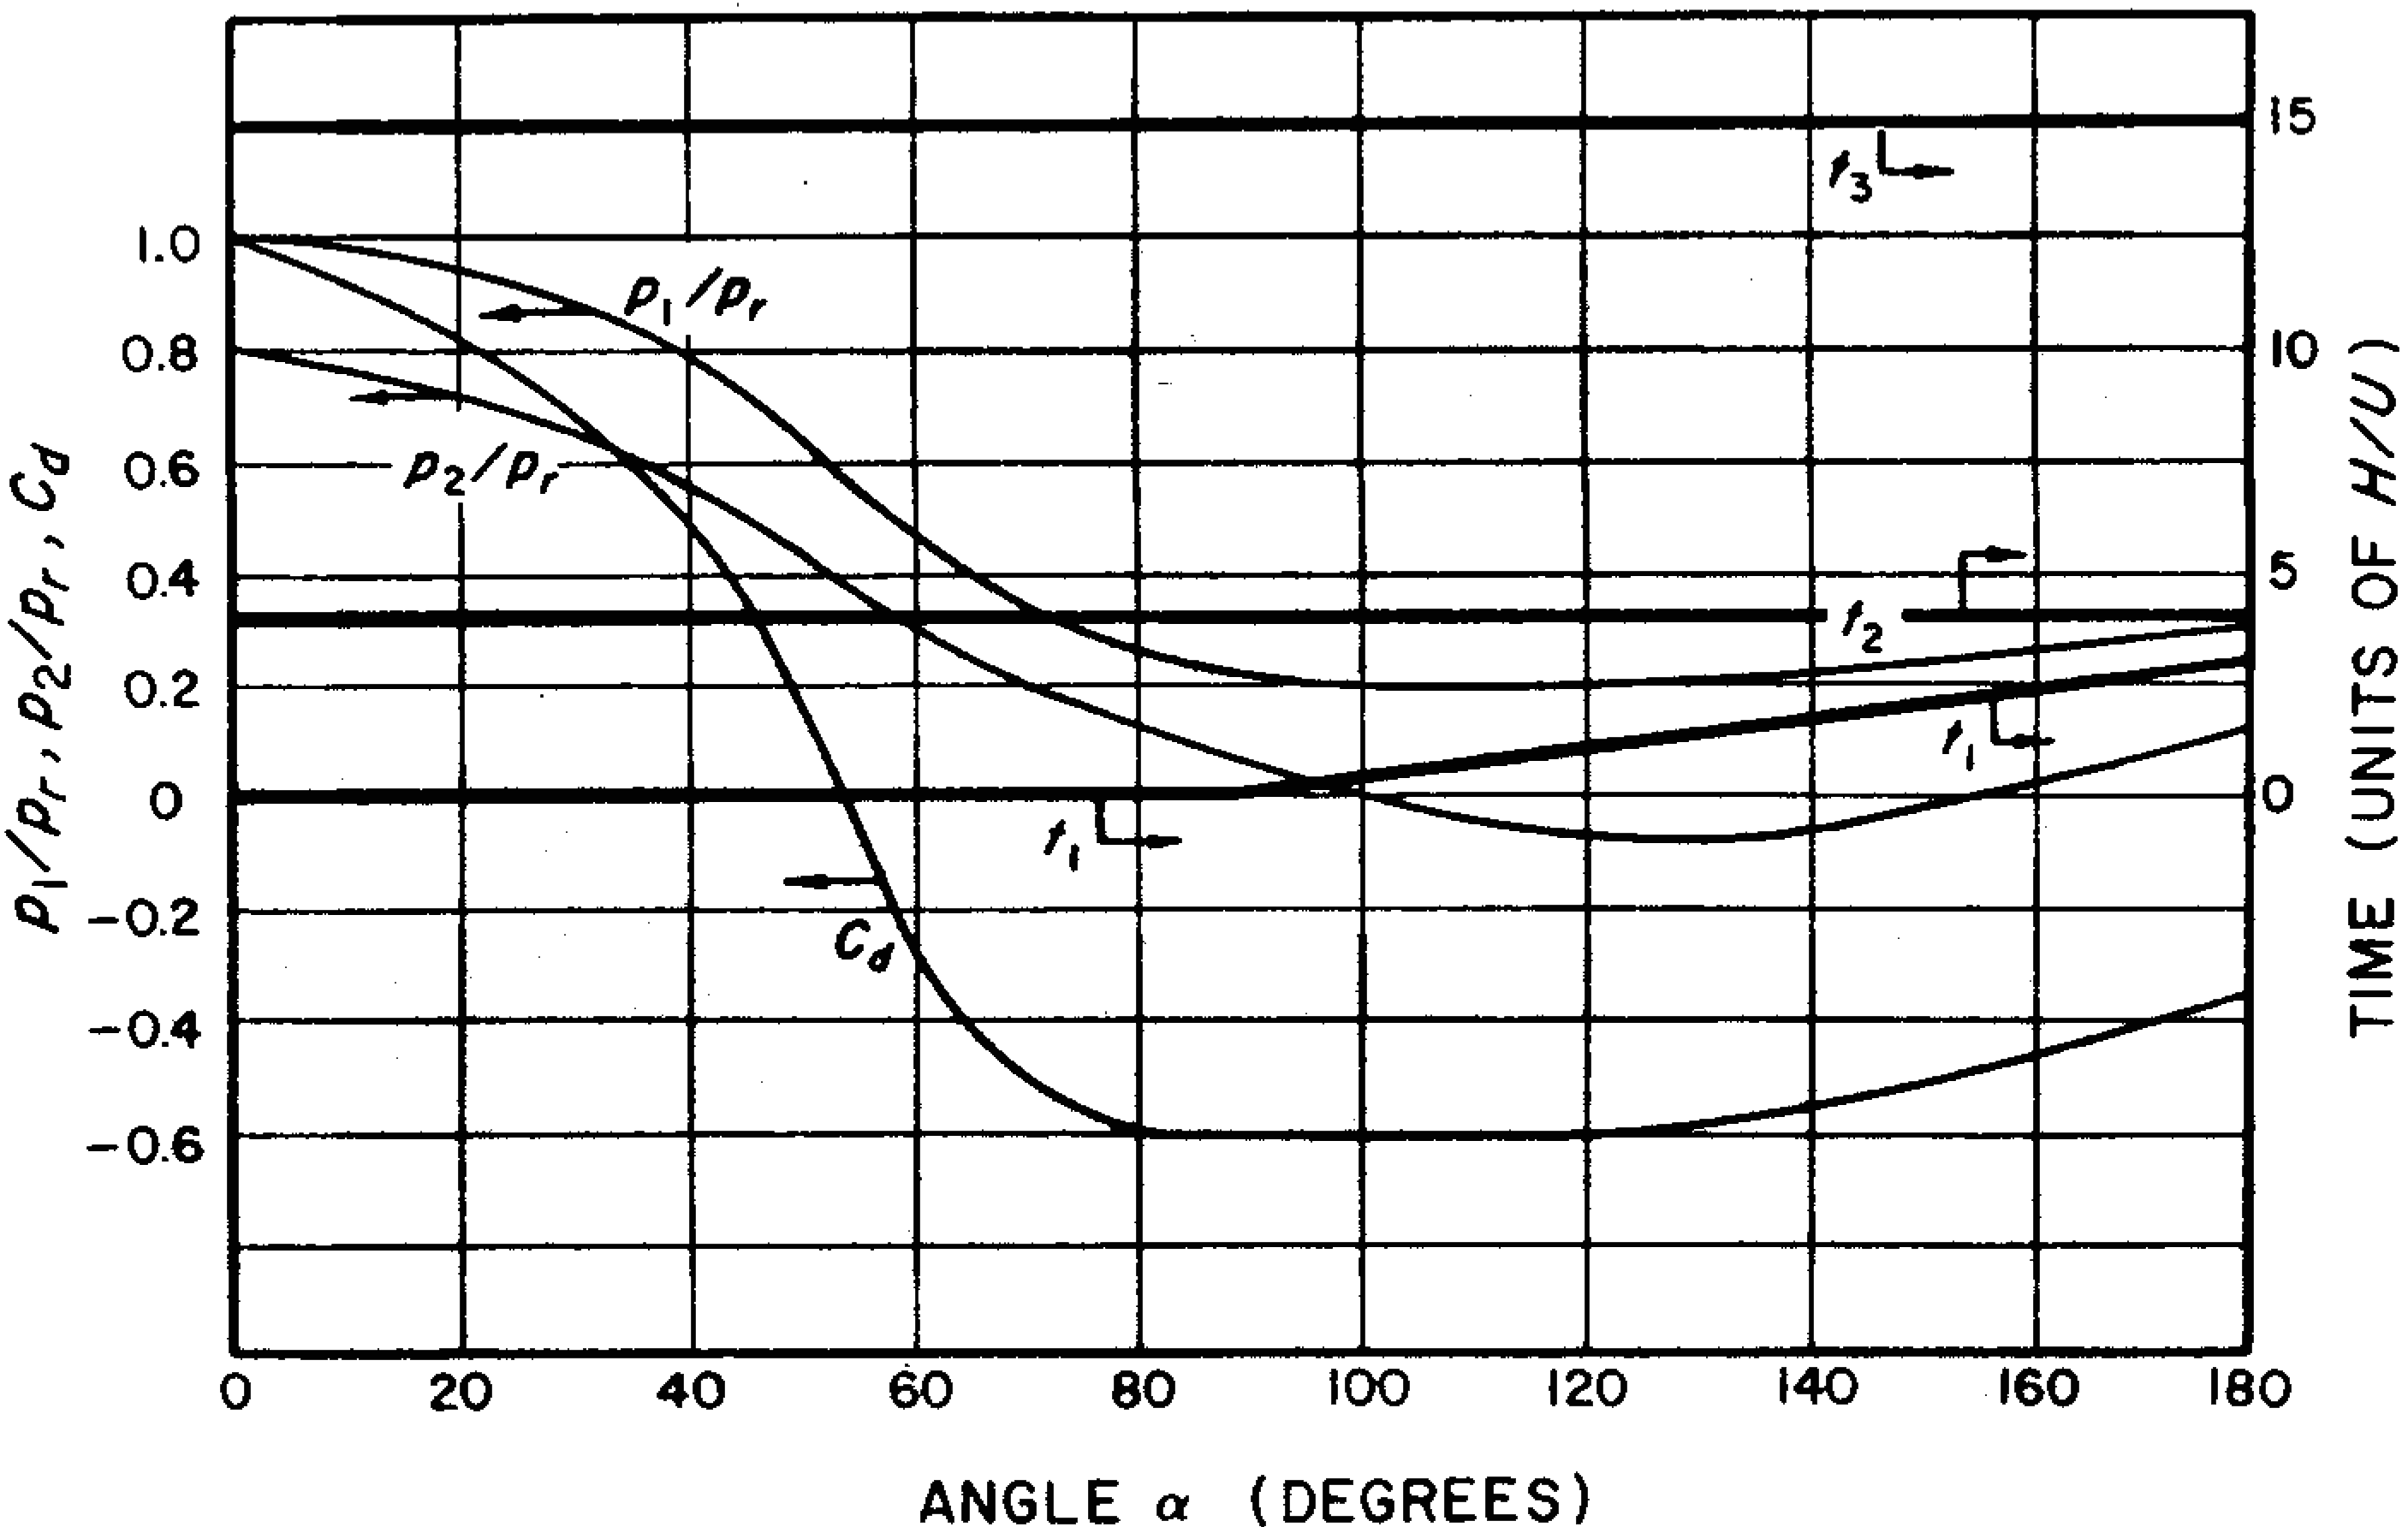
4.64 The dependence of the pressures and and the drag coefficient on the angle is represented in Fig. 4.64; the pressure values are expressed as the ratios to , where is the ideal reflected pressure for a flat surface. When is zero, i.e., at the base of the arch, is identical with , but for larger angles it is less. The rise time and the time intervals and , corresponding to vortex formation and attainment of the stagnation pressure, respectively, after the blast wave reaches the base of the arch, are also given in Fig. 4.64, in terms of the time unit . The rise time is seen to be zero for the front half of the arch, i.e., for a between 0° and 90°, but it is finite and increases with on the back half, i.e., for a between 90° and 180°. The times and are independent of the angle .
4.65 Since the procedures described above give the loads normal to the surface at any arbitrary point , the net horizontal loading is not determined by the simple process of subtracting the back loading from that on the front. To obtain the net horizontal loading, it is necessary to sum the horizontal components of the loads over the two areas and then subtract them. In practice, an approximation may be used to obtain the required result in such cases where the net horizontal loading is considered to be important. It may be pointed out that, in certain instances, especially for large structures, it is the local loading, rather than the net loading, which is the significant criterion of damage.
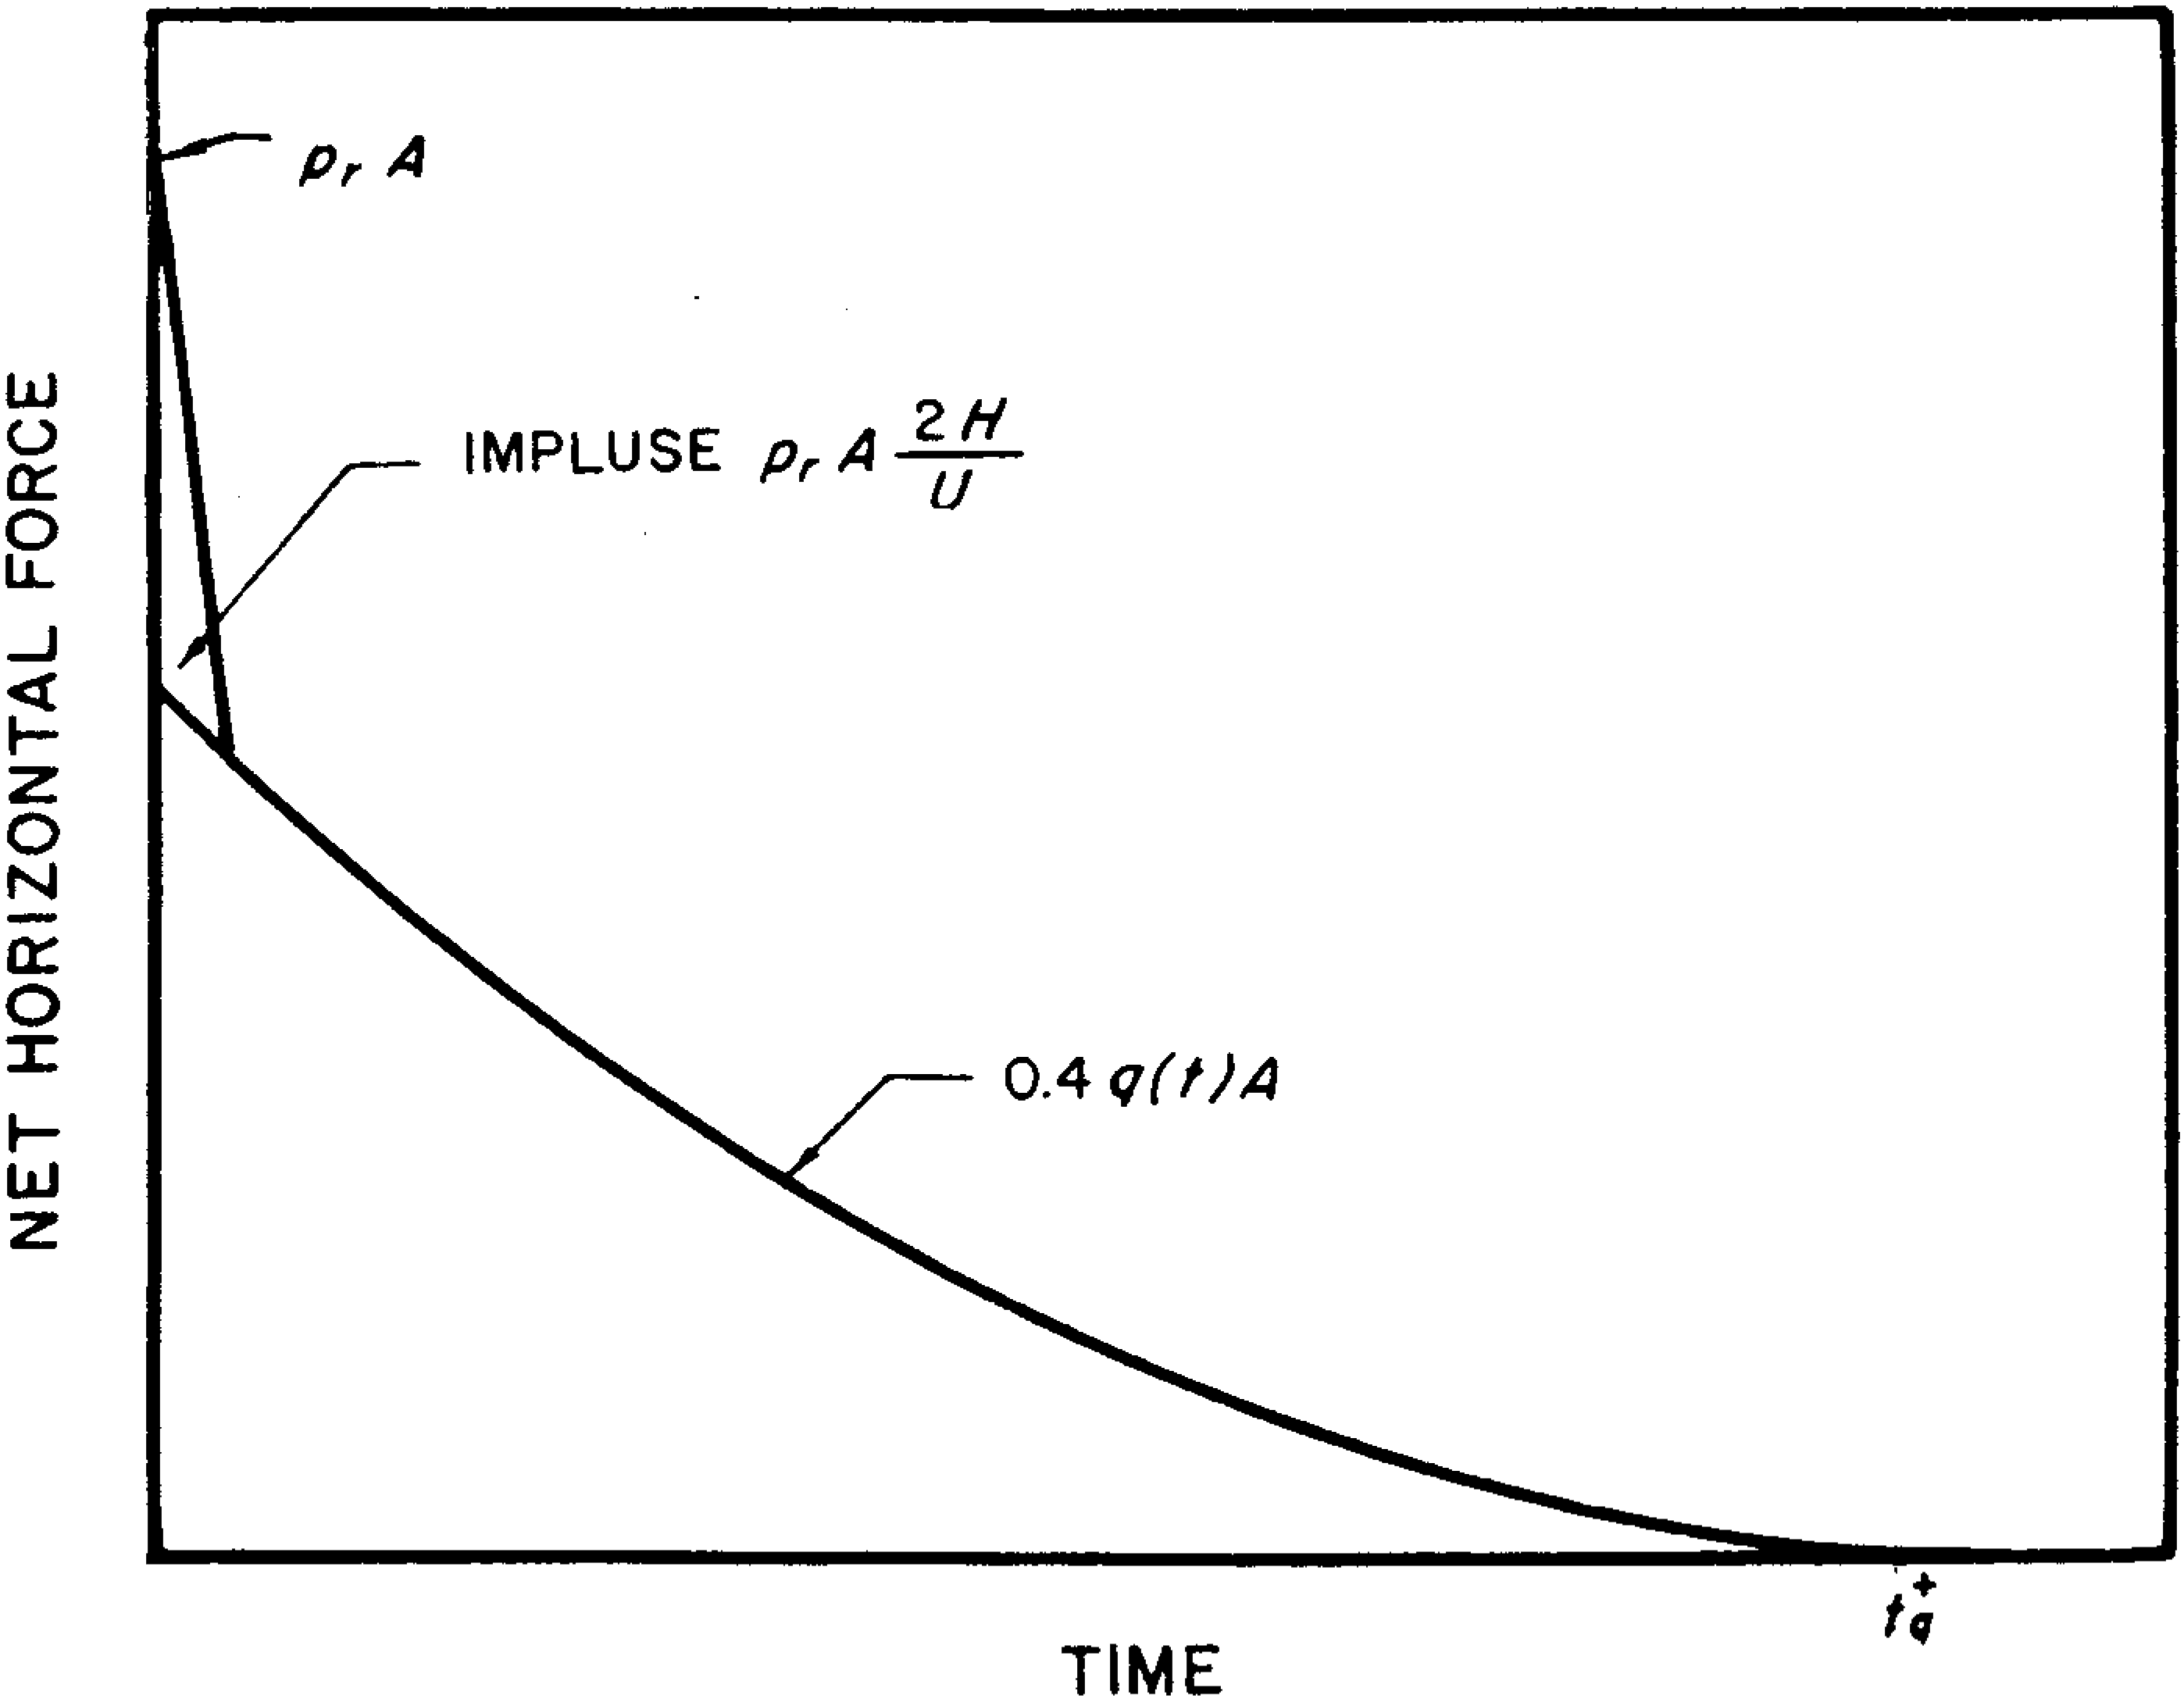
4.66 In the approximate procedure for determining the net loading, the overpressure loading during the diffraction stage is considered to be equivalent to an initial impulse equal to , where is the projected area normal to the direction of the blast propagation. It will be noted that is the time taken for the blast front to traverse the structure. The net drag coefficient for a single cylinder is about 0.4 in the blast pressure range of interest (§ 4.23). Hence, in addition to the initial impulse, the remainder of the net horizontal loading may be represented by the force 0.4 , as seen in Fig. 4.66, which applies to a single structure. When a frame is made up of a number of circular elements, the methods used are similar to those for an open frame structure (§ 4.55) with equal to 0.2.
NONIDEAL BLAST WAVE LOADING
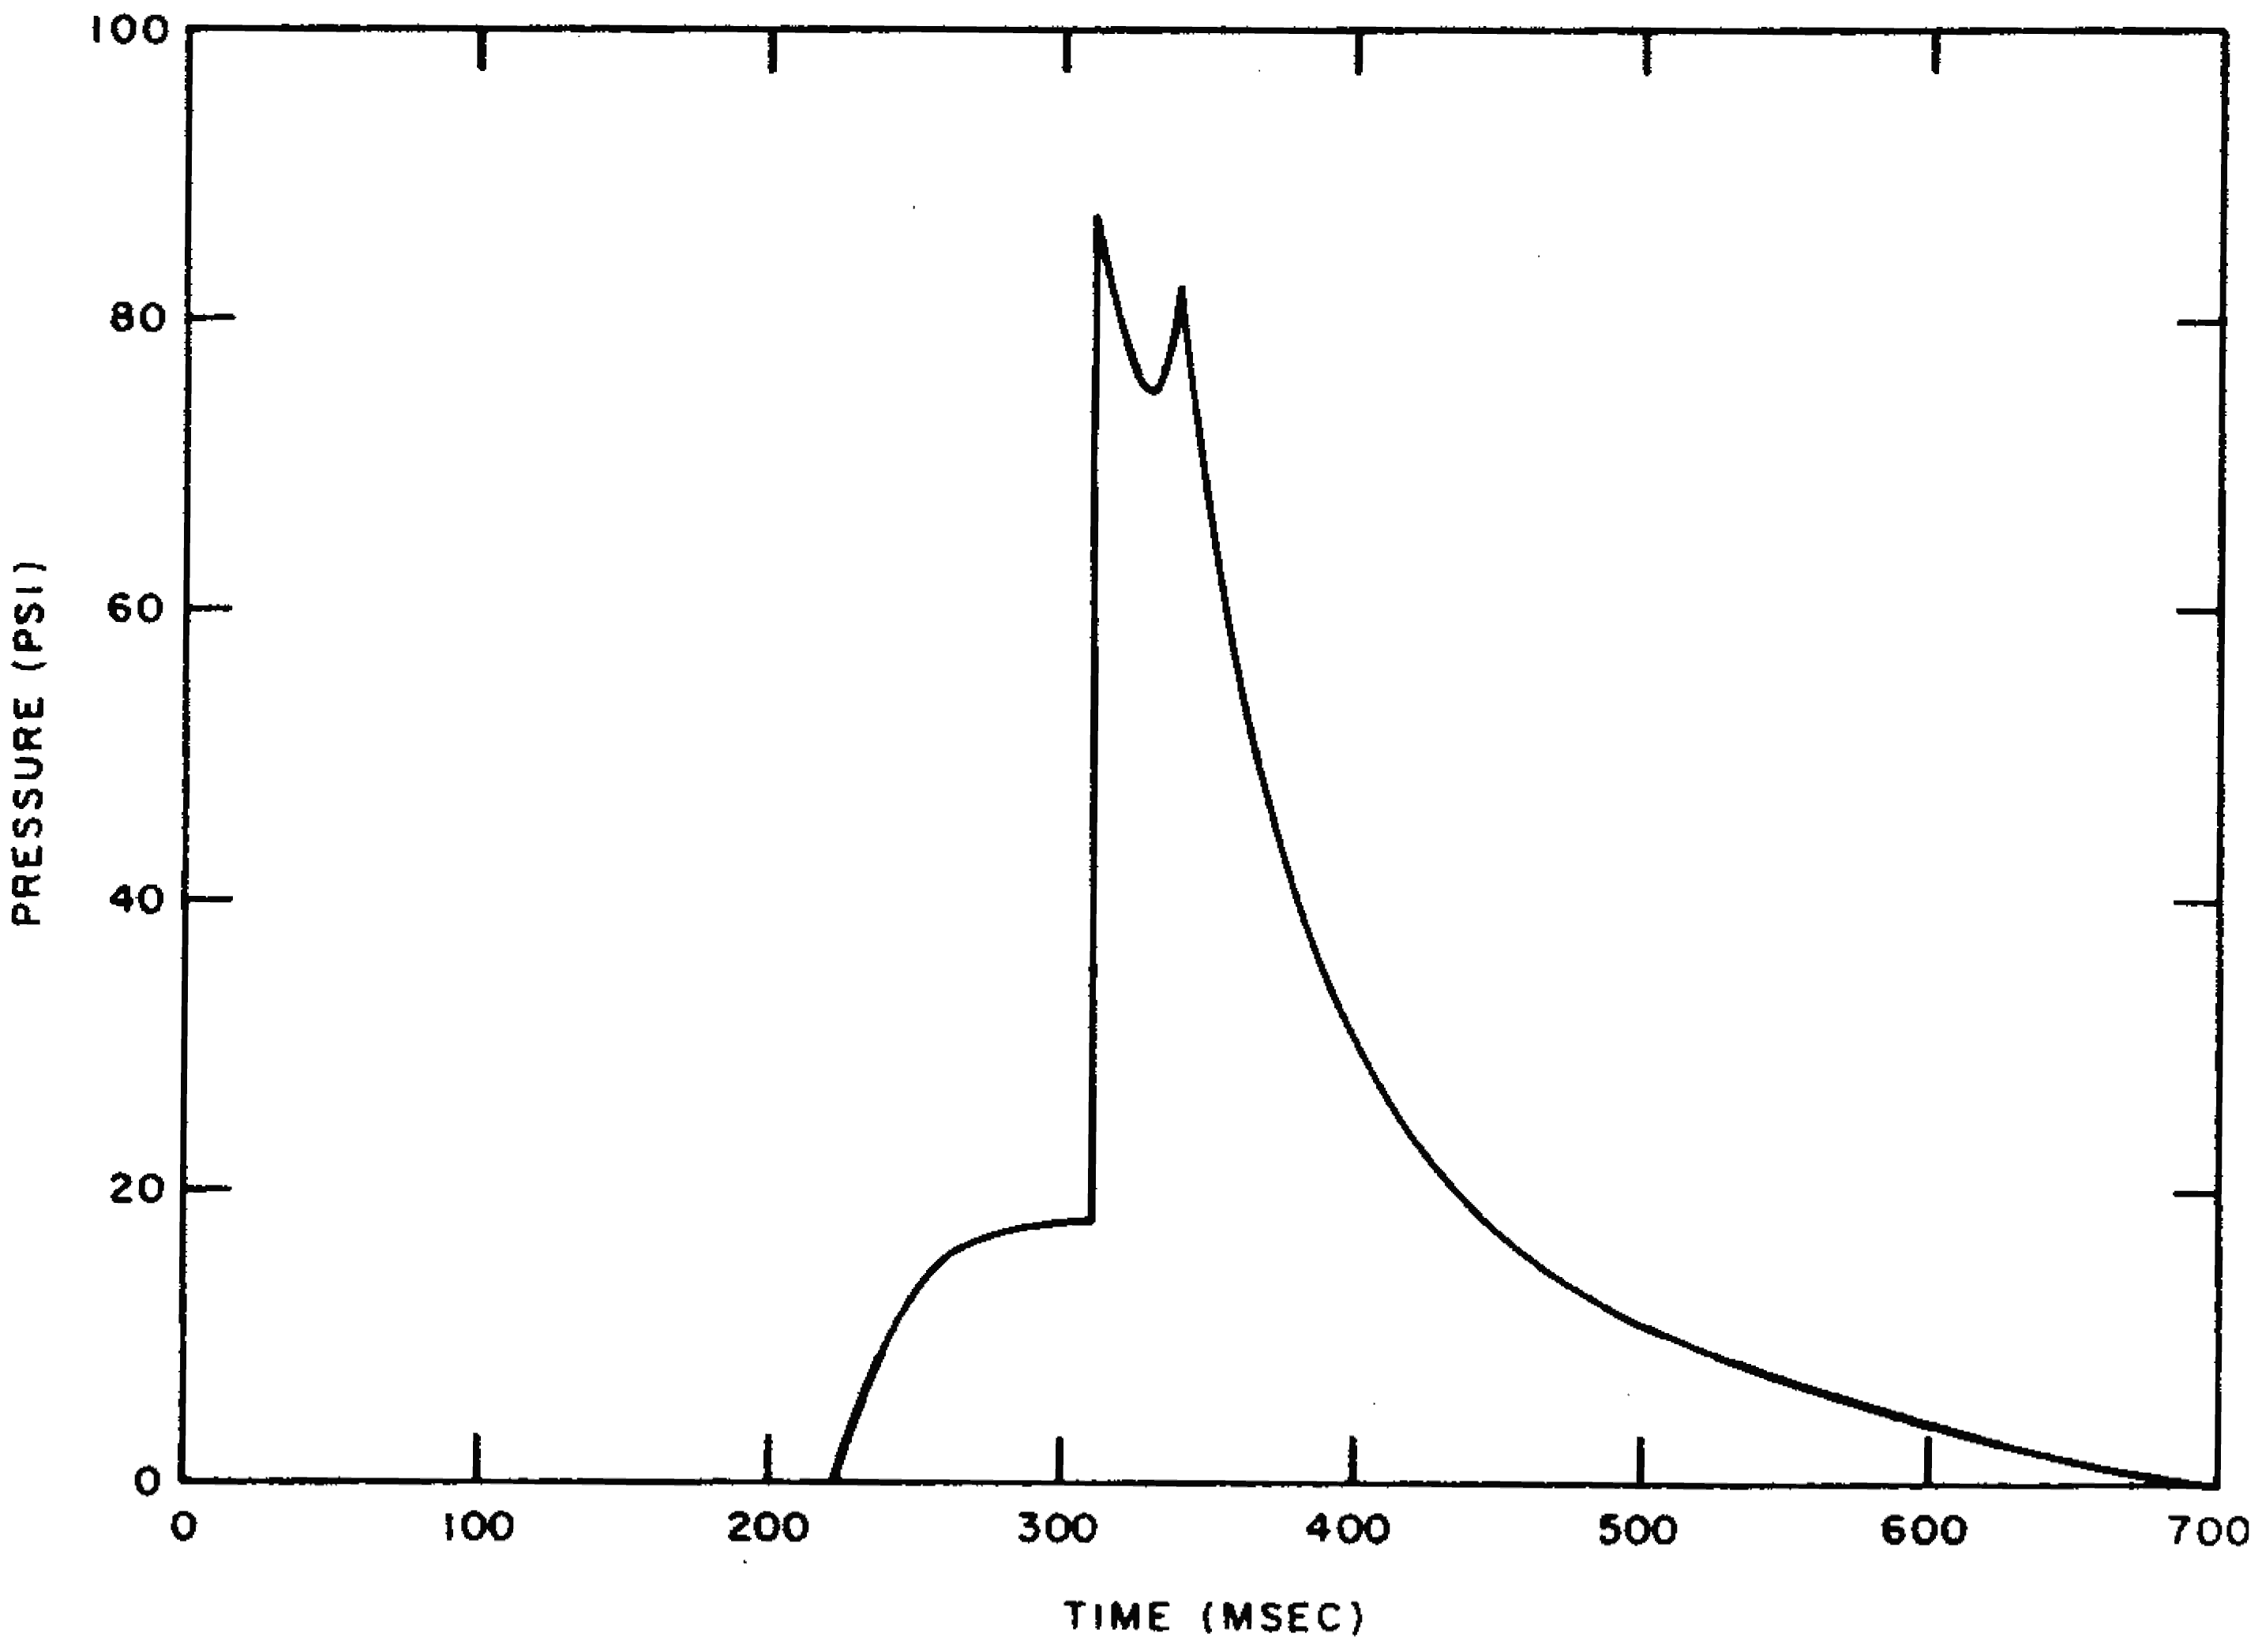
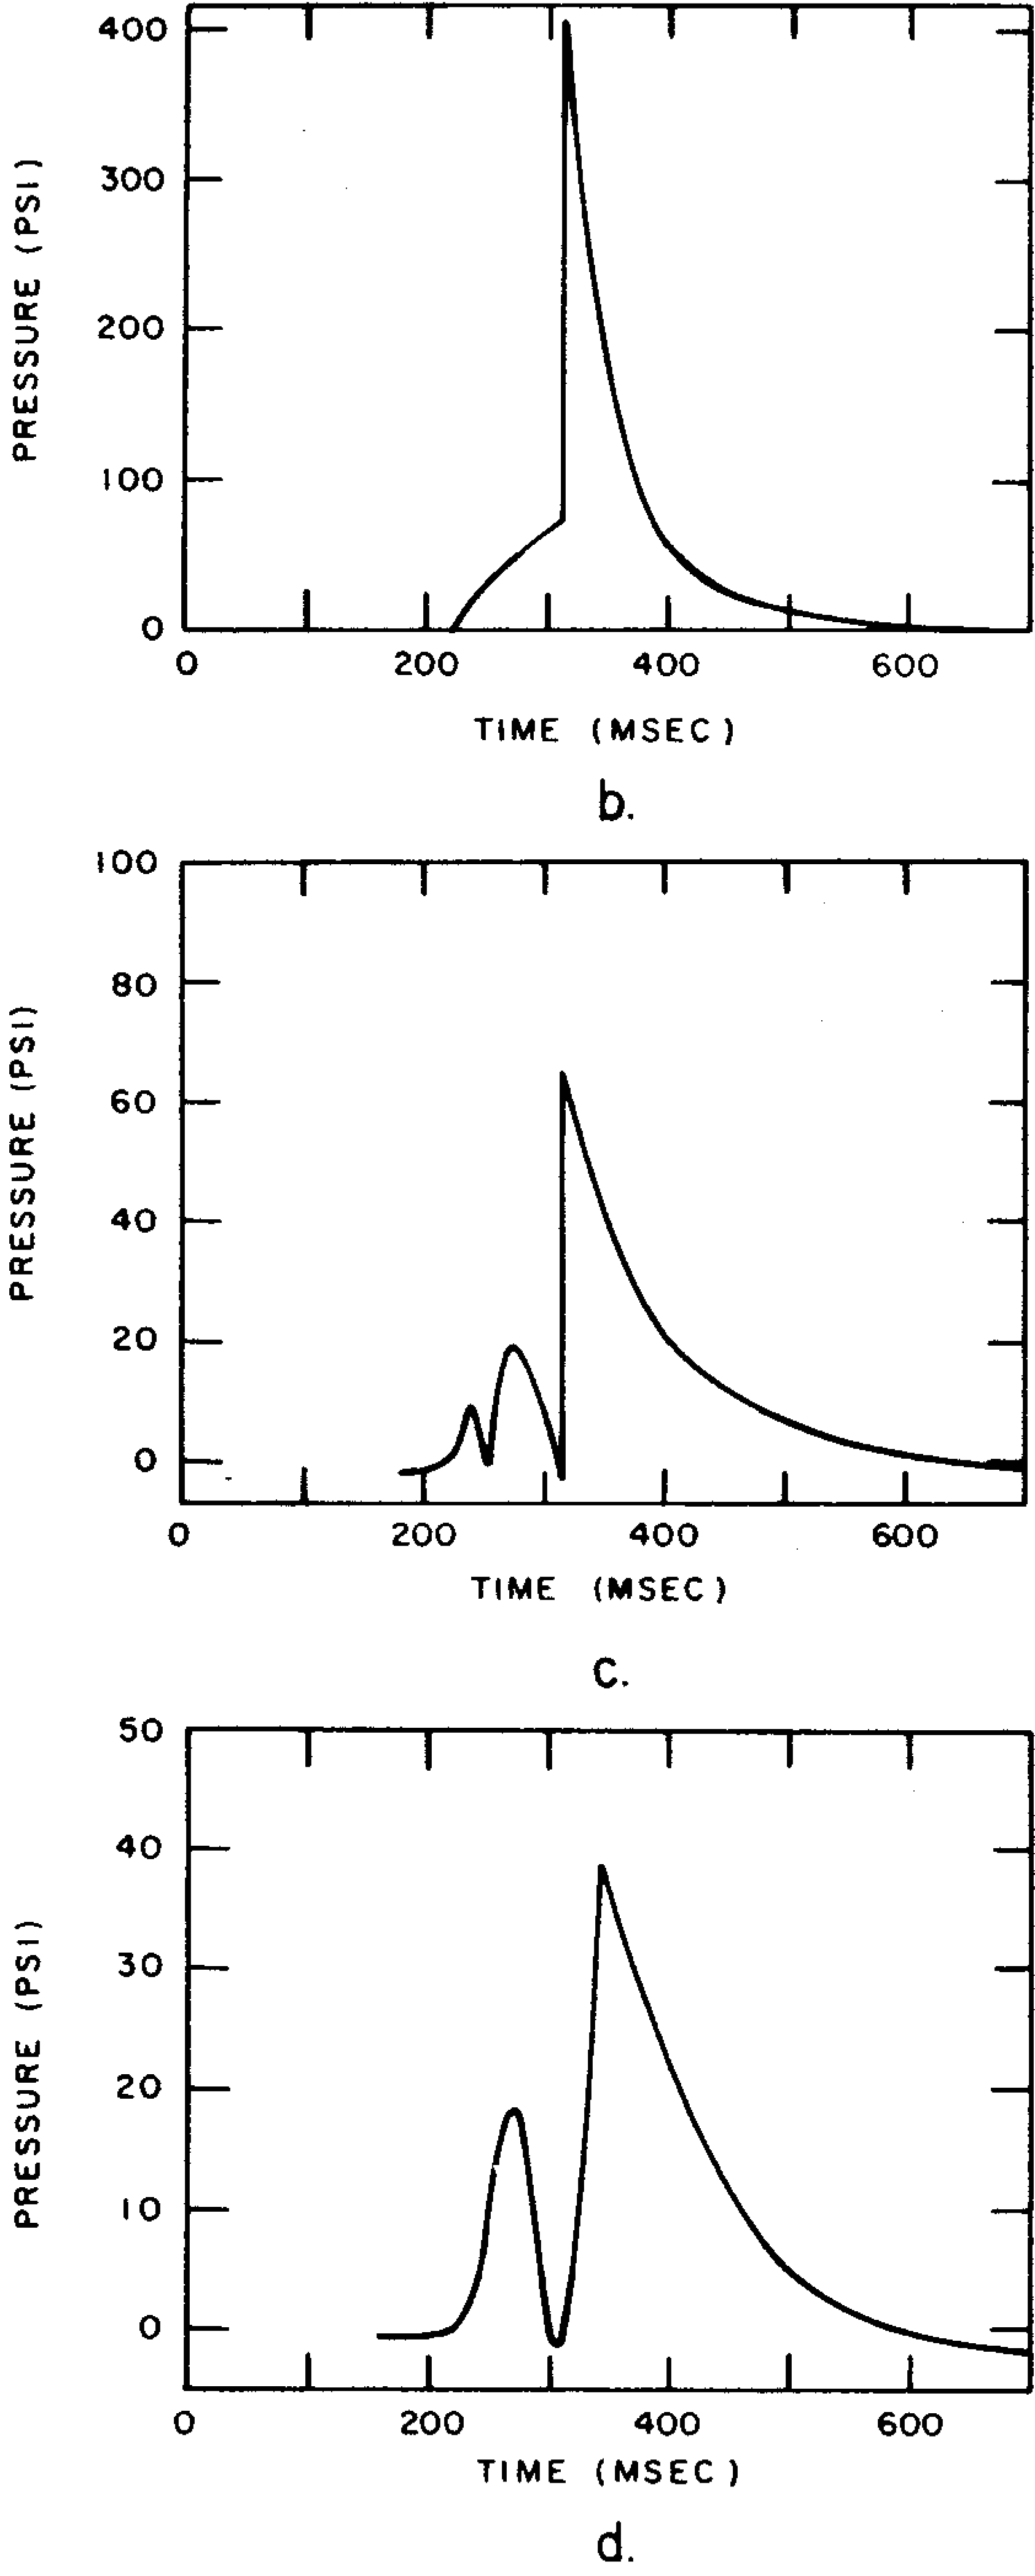
4.67 The preceding discussions have dealt with loading caused by blast waves reflected from nearly ideal ground surfaces (§ 3.47). In practice, however, the wave form will not always be ideal. In particular, if a precursor wave is formed (§ 3.79 et seq.), the loadings may depart radically from those described above. Although it is beyond the scope of the present treatment to provide a detailed discussion of nonideal loading, one qualitative example is given here. Figure 4.67a shows a nonideal incident air blast (shock) wave and Figs. 4.67b, c, and d give the loading patterns on the front, top, and back, respectively, of a rectangular block as observed at a nuclear weapon test. Comparison of Figs. 4.67b, c, and d with the corresponding Figs. 4.42, 4.43, and 4.44 indicates the departures from ideal loadings that may be encountered in certain circumstances. The net loading on this structure was significantly less than it would have been under ideal conditions, but this would not necessarily always be the case.
BIBLIOGRAPHY
- * , “Design of Structures to Resist Nuclear Weapons Effects,” ASCE Manual of Engineering Practice No. 42, 1961.
- * , “A Simple Method of Evaluating Blast Effects on Buildings,” Armour Research Foundation, Chicago, Illinois, 1954.
- * , “Effect of a Precursor Shock Wave on Blast Loading of a Structure,” Sandia Corporation, Albuquerque, New Mexico, October 1960, WT–1472.
- , “Engineering Vibrations,” McGraw-Hill Book Co., Inc., New York, 1958.
- , “Air Blast Loading in the High Shock Strength Region,” URS Corporation, Burlingame, California, 1965, URS 633–3 (DASA 1460–1), Part II.
- * , “Nuclear Explosion Effects on Structures and Protective Construction—A Selected Bibliography,” U.S. Atomic Energy Commission, April 1961, TID–3092.
- , “Probabilistic Air Blast Failure Criteria for Urban Structures,” Stanford Research institute, Menlo Park, California, November 1971.
- , et al., “A Study of Loading, Structural Response, and Debris Characteristics of Wall Panels,” URS Research Co., Burlingame, California, July 1969.
- , et al., “Final Report Summary, Structural Response and Loading of Wall Panels,” URS Research Co., Burlingame, California, July 1971.
* These documents may be purchased from the National Technical Information Service, U.S. Department of Commerce, Springfield, Virginia 22161.
ENDNOTES
- 1 This is often referred to as the “side-on overpressure,” since it is the same as that experienced by the side of the structure, where there is no appreciable reflection. [ref. § 4.06] X
- 2 A more detailed treatment is given later in this chapter. [ref. § 4.07] X
- 3 The drag pressure is the product of the dynamic pressure and the drag coefficient (§ 4.29). diffraction stage will be determined by the magnitude of the loading and by its duration. The loading is related to the peak overpressure in the blast wave and this is consequently an important factor. If the structure under consideration has no openings, as has been assumed so far, the duration of the diffraction loading will be very roughly the time required for the wave front to move from the front to the back of the building, although wind loading will continue for a longer period. The size of the structure will thus affect the diffraction loading. For a structure 75 feet long, the diffraction loading will operate for a period of about one-tenth of a second, but the squeezing and the wind loading will persist for a longer time (§ 4.13). For thin structures, e.g., telegraph or utility poles and smokestacks, the diffraction period is so short that the corresponding loading is negligible. [ref. § 4.09] X
- 4 The remaining (more technical) sections of this chapter may be omitted without loss of continuity. [ref. Section 2] X